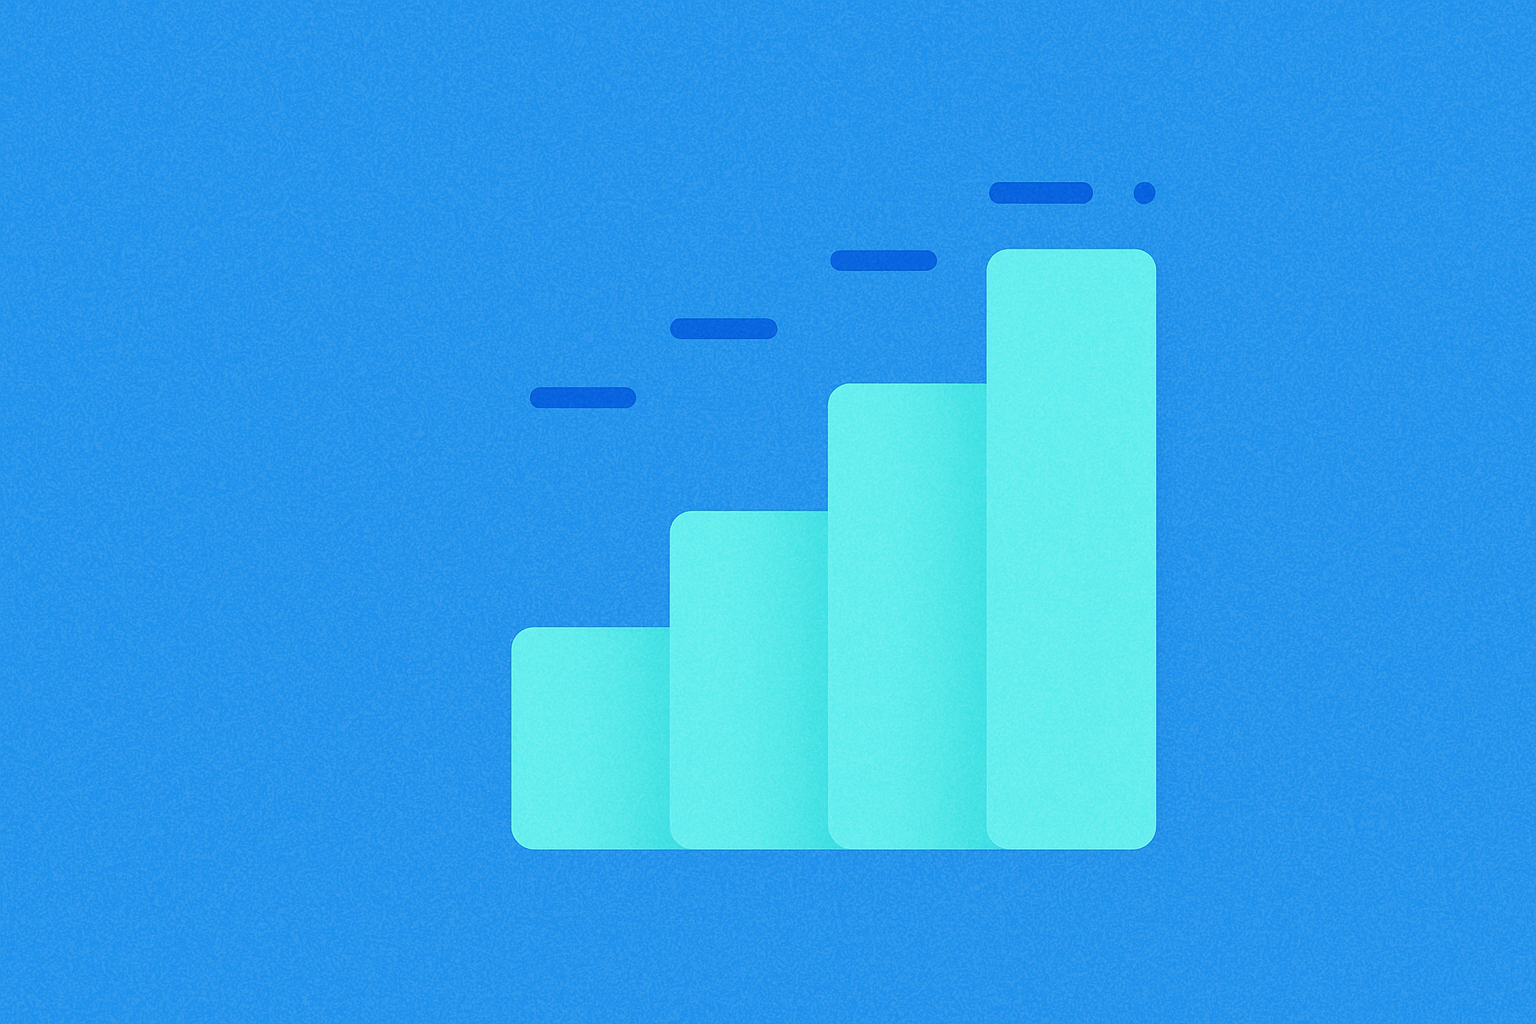
What Does Higher High (HH) Mean?
A higher high refers to a new peak in price that exceeds the previous high.
On a price chart, this indicates that the current market cycle has pushed the price above the prior peak. Higher highs are commonly observed in uptrends and serve as a key indicator for assessing whether bullish momentum remains intact. Traders often focus more on whether the closing price can decisively stay above the previous high, rather than momentary intraday spikes.
Why Is Understanding Higher Highs Important?
Higher highs offer a clear signal for identifying uptrends.
Statistically, trading with the trend tends to be more advantageous than trading against it. The formation of a higher high suggests strong buying interest—market participants are willing to transact at higher prices, encouraging trend-following strategies. Ignoring higher highs can result in frequent short positions or premature profit-taking during strong trends, causing traders to miss significant market moves.
Higher highs also aid in risk management. If the price quickly falls back below the previous high after setting a new peak, it signals weakening momentum and can serve as a trigger to reduce positions or set stop-losses, helping to avoid drawdowns caused by failed breakouts.
How Do Higher Highs Work?
Identifying higher highs involves a straightforward process:
- Choose Your Timeframe: Higher highs can occur on daily, 4-hour, or 1-hour charts, but their significance varies. The larger the timeframe, the more reliable the signal—and the longer the typical holding period.
- Mark the Previous High: Identify the last prominent swing high as your reference point. Use horizontal lines to mark it on your chart for clarity and accuracy.
- Check for a Confirmed Close: Wait for a full candlestick to close above the previous high before confirming the higher high, reducing the likelihood of false breakouts.
- Observe Volume and Pullbacks: A breakout accompanied by increased volume is more convincing. If the price pulls back after breaking out but holds above the prior high (turning resistance into support), the signal is stronger.
- Multi-Timeframe Analysis: Use higher timeframes (like daily) for overall trend direction and lower timeframes (like 1-hour) to pinpoint entry opportunities after retracements or consolidations.
Example: If a token’s daily swing high was $100, then it closes at $102 with volume above its 5-day average, and later retests $100 without falling below it before moving higher again, most traders will recognize this as a confirmed higher high and consider following the trend.
How Are Higher Highs Typically Seen in Crypto Markets?
Higher highs are most commonly observed during trading, new listings, and sector rallies.
On Gate’s spot and contract trading platforms, both order book depth and trading volume usually increase when prices break above previous highs. This can trigger copy trading strategies or grid bots to adjust positions. For instance, after positive news about a new narrative token, a surge above the previous high may attract strong spot buying and leveraged long positions, fueling further price appreciation.
Higher highs appear more frequently around major events or new listings. For example, when leading tokens experience protocol upgrades, ETF news, or exchange listings, these events often coincide with breakout volumes and successive steps up in price within a short period.
In DeFi tokens with lower liquidity, breakouts can be even more pronounced but are also prone to false signals; slippage and transaction fees have a greater impact on real returns.
Gate Practical Example:
- Step 1: Spot Market Observation – Draw a line at the previous high and wait for a daily close above it before buying to minimize the risk of chasing.
- Step 2: Contract Execution – Place limit orders near retracement levels or use conditional orders to buy on breakout triggers. Keep leverage within manageable limits—favor lower leverage.
- Step 3: Synchronized Risk Control – Set stop-loss orders slightly below the previous high and use trailing take-profit strategies to follow each new breakout step.
How to Reduce False Signals When Trading Higher Highs?
The key is filtering out fake breakouts and managing risk:
- Wait for Confirmation on Close: Intraday spikes are common—take action only after a confirmed close above the previous high. For highly volatile coins, set a confirmation margin of 0.5%–1% above the prior high.
- Check Volume-Price Alignment: Breakouts with rising volume are more credible; if volume declines on a breakout, exercise caution and wait for a pullback that holds before entering.
- Validate with Pullbacks: If the previous high becomes support and holds after a retest, the signal is stronger. Consider scaling in during stable pullbacks to average your entry price.
- Multi-Timeframe Alignment: Enter trades when both higher and lower timeframes support bullish momentum; if smaller timeframes weaken, it's safer to wait.
- Use Volatility Thresholds: Average True Range (ATR) measures market volatility—use it to set stop-loss distances that account for normal price fluctuations.
- Manage Trading Costs: Breakout strategies often encounter slippage and fees; if costs erode your expected edge, the strategy may not be statistically viable.
On Gate, you can use OCO (One Cancels the Other) orders for position management: immediately set both stop-loss and take-profit levels upon breakout confirmation to avoid emotional decision-making.
What Recent Trends or Data Points About Higher Highs Are Worth Noting?
Over the past year, higher highs have frequently coincided with event-driven catalysts.
Public market data shows that in March 2024, Bitcoin repeatedly set new all-time highs during both intraday moves and daily closes, peaking around $73,000; Ethereum’s local high reached around $4,000 in the same month. These higher highs often align with policy shifts or major capital inflows—for example, the launch of US spot Bitcoin ETFs in early 2024 brought increased buying pressure and market attention.
In terms of timing, from early 2024 through January 2026, major tokens' higher highs tend to cluster around key data releases, major upgrades, or capital inflow peaks—often followed by pullbacks that hold above prior highs before renewed rallies. During heightened volatility phases, higher highs occur more frequently but so do false breakouts.
Self-Check Path:
- Open TradingView or your exchange’s charting tool and set your timeframe to daily candles. Mark every daily close that breaks above a previous high over the past year.
- Record whether breakout days coincide with above-average 5-day trading volumes for “volume confirmation.”
- Measure both maximum drawdown and maximum gain within five trading days after each breakout—this helps assess whether your stop-loss and take-profit thresholds are appropriate.
What’s the Difference Between Higher Highs and Lower Lows?
They respectively indicate upward and downward trends.
A higher high marks a new peak above the previous one (“stepping up”) and is typically used for trend-following long trades. A lower low is a new trough below the previous low (“stepping down”) and is used for trend-following shorts or managing downside risk. If prices form higher highs while holding above previous lows on retracements, it signals a robust uptrend; conversely, if new highs are quickly followed by breaks below prior lows, upward momentum is likely fading and risk should be tightened.
In practice, using both together is more reliable: use higher highs to determine trend direction and monitor whether retracements break prior lows as your risk management “red line.”
Key Terms
- Higher High: A technical analysis term indicating that price has set a new peak above its previous high—typically signals continued uptrend strength.
- Technical Analysis: A method of forecasting future market movements by studying historical price action and trading volume.
- Trend: The general direction of market prices—classified as uptrend, downtrend, or sideways movement.
- Support Level: A price area where buying interest is expected to emerge during declines—often forms a base for price rebounds.
- Resistance Level: A price area where selling pressure tends to cap advances—often halts further upward movement.
FAQ
What’s the Difference Between a Higher High and a Swing High?
A higher high (HH) refers to each successive peak being higher than the last within an ongoing uptrend; “Swing High” describes any local maximum in technical analysis—it doesn’t necessarily confirm an uptrend continuation. In essence, higher highs focus on trend continuity (several rising peaks), while swing highs simply identify individual local tops—the criteria for confirmation are stricter for higher highs.
How Can I Accurately Identify Higher Highs?
To spot higher highs, observe at least two price peaks—ensure each subsequent peak exceeds its predecessor—and confirm with trading volume for trend strength. Combine candlestick charts with support and resistance levels to avoid being misled by isolated rebounds. Beginners should operate on longer timeframes (daily or weekly) to filter out noise and improve accuracy.
Does a Higher High Guarantee Further Price Increases?
While a higher high usually signals trend continuation, it does not guarantee further gains. If prices fail to break above their last higher high, trends may reverse or consolidate instead. Always consider trading volume, support levels, and overall market sentiment—higher highs alone cannot predict future moves with certainty. Robust risk management and stop-loss orders remain essential.
What Should I Watch Out For When Trading Higher Highs in Crypto?
Only open positions after confirming a higher high has formed—avoid premature entries. Set stop-loss orders just below relevant support levels (usually under the most recent higher high) to manage risk per trade. Monitor liquidity and volatility—smaller tokens are prone to false breakouts; it’s advisable to trade major coins on liquid platforms like Gate to reduce slippage risk.
Are Higher High Patterns Useful in Bear Markets?
The relevance of higher highs diminishes during bear markets because overall trends are downward—a local higher high often signals only a temporary bounce rather than a full reversal. In bear phases, focus on identifying “lower lows” to confirm downtrends; if trading during bear markets, use shorter timeframes to spot rare higher high setups but be aware that risks are elevated and caution is warranted.
Further Reading