

Post content & earn content mining yield
placeholder
ChainSeaDigger
- Reward
- 16
- 7
- Repost
- Share
GasGuzzler :
:
Having money means causing trouble, haha.View More
- Reward
- 7
- 6
- Repost
- Share
CoffeeOnChain :
:
hype has gone to the moon famView More
#ETC# analysis ETC
1. Structure and Model
• The chart shows a large-scale cup and handle pattern or parabolic curve model.
• The parabolic curve from the end of 2019 to now shows that the long-term growth trend is still maintained.
• Each previous rising cycle (2017 → 2021) has shown a strong increase compared to the previous bottoms.
⸻
2. Important Price Nodes
• Old resistance areas: 46 USD, 175 USD, 705 USD ( is the historical high ).
• Currently: the price is around ~23.6 USD, having just rebounded from the bottom range that lasted from 2022 to 2025.
• Recent resistance area: $46 — if
View Original1. Structure and Model
• The chart shows a large-scale cup and handle pattern or parabolic curve model.
• The parabolic curve from the end of 2019 to now shows that the long-term growth trend is still maintained.
• Each previous rising cycle (2017 → 2021) has shown a strong increase compared to the previous bottoms.
⸻
2. Important Price Nodes
• Old resistance areas: 46 USD, 175 USD, 705 USD ( is the historical high ).
• Currently: the price is around ~23.6 USD, having just rebounded from the bottom range that lasted from 2022 to 2025.
• Recent resistance area: $46 — if
- Reward
- 1
- Comment
- Repost
- Share
- Reward
- like
- Comment
- Repost
- Share
Whale Alert: #Hyperliquid# Whale (0x9311) Long $ETH with 25x leverage, entry price $4385.55, position value $2.21M.
Source: CoinGlass
#crypto#
Source: CoinGlass
#crypto#
- Reward
- like
- Comment
- Repost
- Share
Who to follow
More
HuageFinancialResearch
2023 Peak Streamer Competition 2nd place, 5 years of live streaming experience, professional analysis of alts market and contract current price orders, trying to help brothers minimize pitfalls and avoid detours.
BitcoinLord
Welcome new fren to join the master
GateLive
Streamer Exclusive Benefits
1. Live mining program- Enjoy up to 70% commission
2.Official support plan
3.Double commission(60 days), VIP+1, etc.
Pi Network is not just another coin — it’s a revolution in the making. With over 45 million users already mining Pi from their phones for free, the project is building one of the largest crypto communities in the world. Now with the mainnet live, Pi is preparing for full exchange listings and real-world utility. This is your chance to get in before the world catches on. It's still early, still cheap, and the upside potential is massive. Don’t wait until it hits headlines — be the one who bought Pi before everyone else did. #pi# #btc#
- Reward
- 2
- 1
- Repost
- Share
GateUser-de687c30:
sand sculpture
- Reward
- like
- Comment
- Repost
- Share
- Reward
- like
- Comment
- Repost
- Share
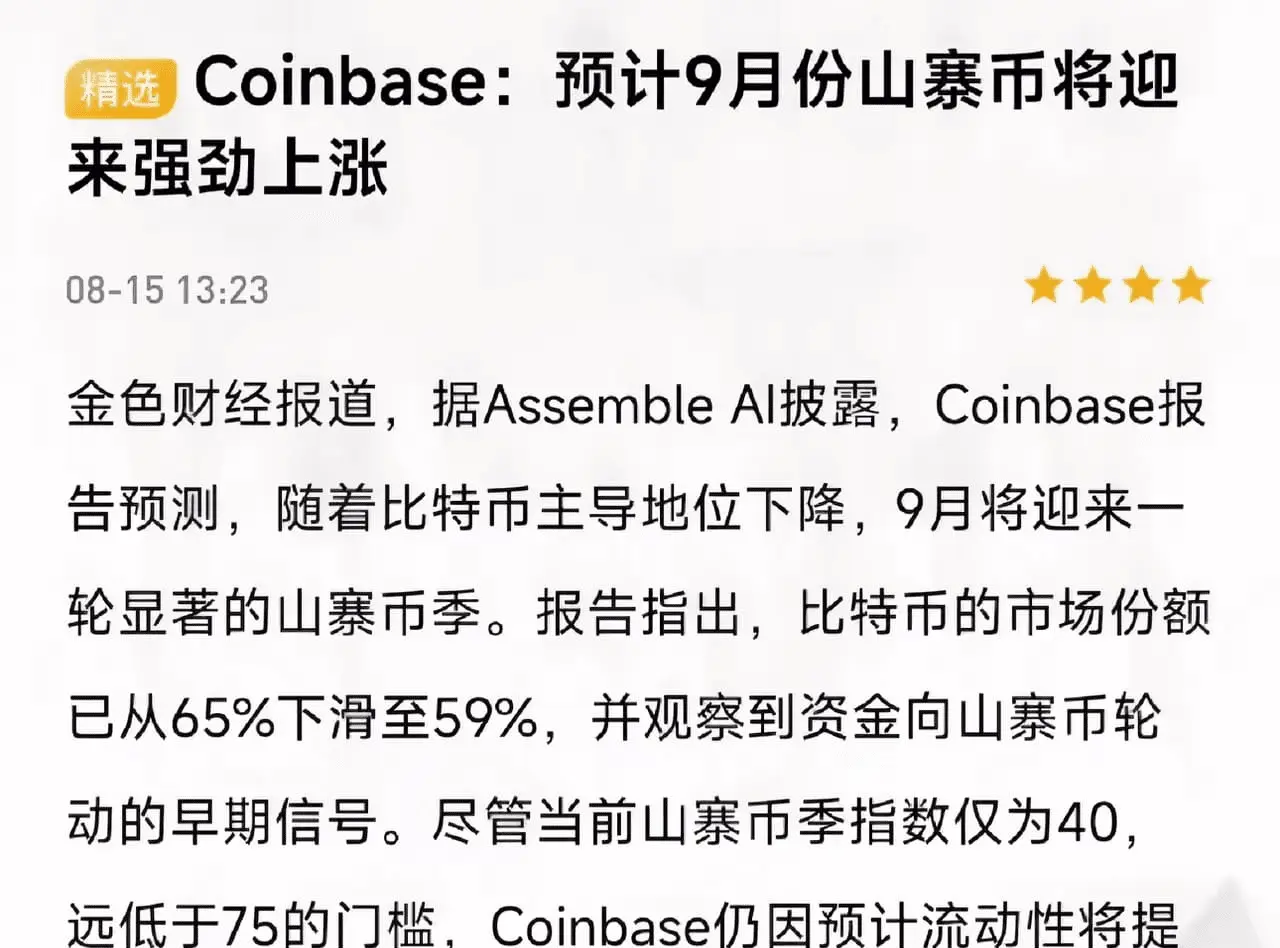
Recently, the cryptocurrency market has shown some interesting changes. According to the latest research report released by Coinbase, Bitcoin's share in the overall market has decreased from 65% to 59%, indicating that funds are gradually shifting towards other encryption currencies.
Although the current 'Shanzhai Coin Season Index' is only 40, far below the commonly believed breakout threshold of 75, Coinbase is optimistic about the market trend in September. They predict that with the increase in market liquidity, multiple alternative coins may see significant rises.
However, we need to main
View OriginalAlthough the current 'Shanzhai Coin Season Index' is only 40, far below the commonly believed breakout threshold of 75, Coinbase is optimistic about the market trend in September. They predict that with the increase in market liquidity, multiple alternative coins may see significant rises.
However, we need to main
- Reward
- 4
- 3
- Repost
- Share
just_here_for_vibes :
:
To enter a position before the alts take off.View More
- Reward
- 8
- 3
- Repost
- Share
OnchainUndercover :
:
It pales in comparison to Pudgy.View More
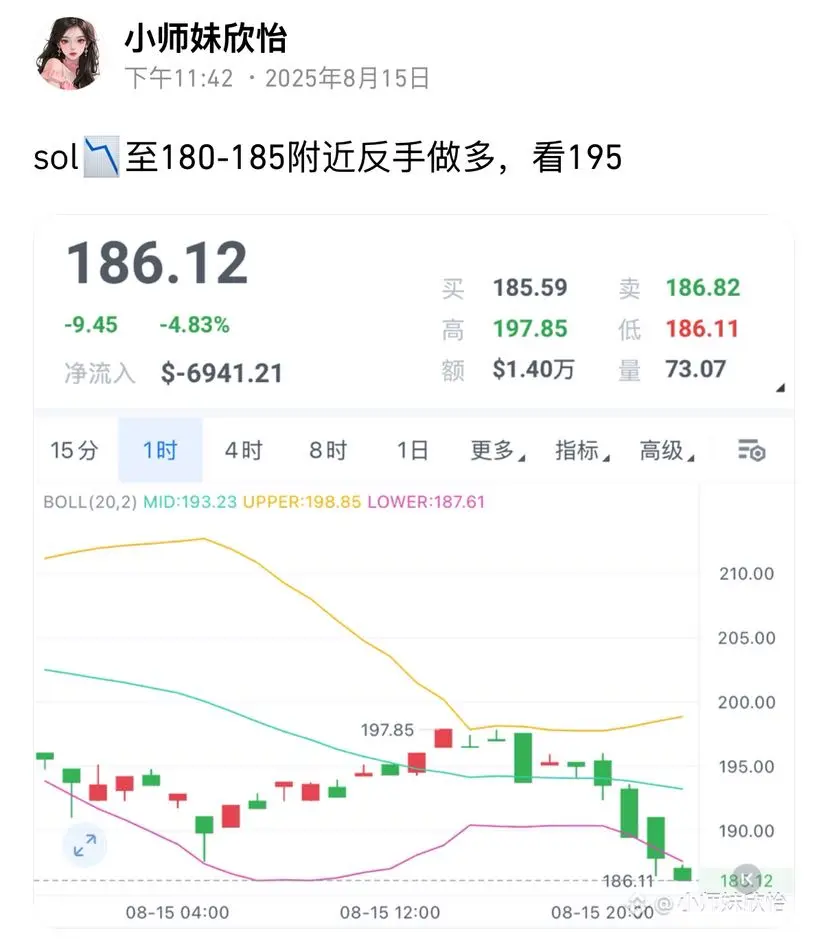
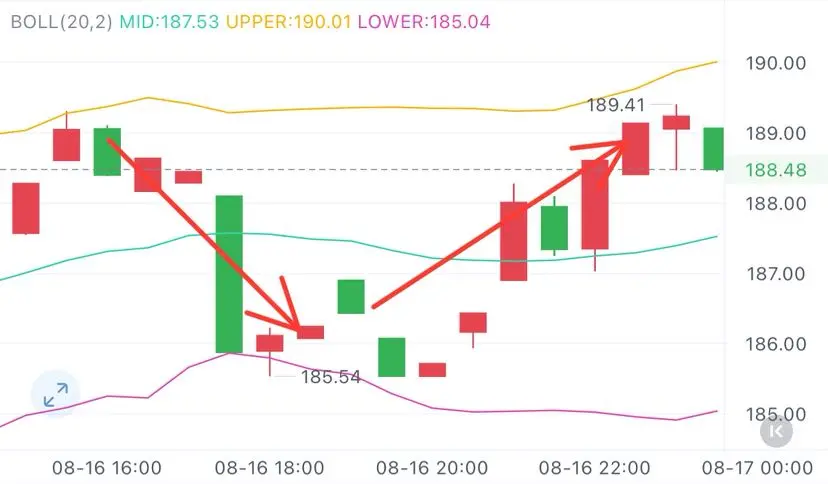
Sol has suggested taking the opposite position to go long as it falls to around 185, and the market is gradually aligning with this idea!
SOL2.33%
- Reward
- like
- Comment
- Repost
- Share
LTC price prediction: Target to reach $132 to $145 by September 2025.
Litecoin (LTC), as one of the well-known cryptocurrencies in the market, has recently experienced various bullish and bearish signals. Looking ahead, especially targeting September 2025, analysts are optimistic about LTC's potential, predicting its price will range between $132 and $145. This forecast comes against the backdrop of short-term bearish momentum.
Litecoin (LTC), as one of the well-known cryptocurrencies in the market, has recently experienced various bullish and bearish signals. Looking ahead, especially targeting September 2025, analysts are optimistic about LTC's potential, predicting its price will range between $132 and $145. This forecast comes against the backdrop of short-term bearish momentum.
LTC0.8%
- Reward
- like
- Comment
- Repost
- Share
This Weekend's Focus! 📅
Hey everyone 👋,
This weekend, we'll be diving into some exciting content to sharpen our skills and knowledge 🔥. Here’s what to expect:
An update on previous overviews on;
Crypto Market Overview:
We’ll take a top-down view of the crypto market 🔎, covering Total1, Total2, Total3, USDT.D, and BTC charts 🪙.
Get ready to learn and grow with us this weekend! 🔥 Let’s make it a productive one 💪.
- Reward
- like
- Comment
- Repost
- Share
excited to bring onboard an advisor for Cerebro
we're bringing on world class builders, content creators and product specialists to build the portfolio manager for the masses
there's so much more to do and we cant wait to unveil more!
we're bringing on world class builders, content creators and product specialists to build the portfolio manager for the masses
there's so much more to do and we cant wait to unveil more!
MORE0.31%
- Reward
- 7
- 4
- Repost
- Share
RamenDeFiSurvivor:
What can we do? Let's take a look first.View More
The presidents of the United States and Russia recently held a high-level meeting aimed at discussing a ceasefire in Ukraine, but ultimately failed to reach a specific protocol. This is the first time Russian President Putin has set foot on U.S. soil since the United Nations General Assembly in 2014. Although both sides stated that progress was made in certain areas, differences still remain.
Putin described this meeting as a "starting point," emphasizing the deterioration of U.S.-Russia relations and considering this meeting to be the first step towards improving bilateral relations. Meanwhil
Putin described this meeting as a "starting point," emphasizing the deterioration of U.S.-Russia relations and considering this meeting to be the first step towards improving bilateral relations. Meanwhil
BTC0.2%
- Reward
- 8
- 2
- Repost
- Share
MintMaster:
Silly coin falls for nothing, it rebounds right after.View More
#USDC发展动态# USDC Circulating Supply big pump! It seems that there is still demand in the stablecoin market. A scale of 61.3 billion coins is quite impressive, a 90% rise compared to last year. However, Circle reported a net loss of 482 million USD, mainly due to IPO-related expenses. I think this is a good opportunity for profit seekers, as the USDC ecosystem may have new projects and Airdrops. I suggest everyone follow Circle's movements to see if there are any new interaction opportunities. Remember to control costs and not blindly invest too much. Be prepared first, so you can act quickly wh
View Original
- Reward
- like
- Comment
- Repost
- Share
- Reward
- like
- Comment
- Repost
- Share
Load More
Join 30 million users in our growing community
⚡️ Join 30 million users in the crypto craze discussion
💬 Engage with your favorite top creators
👍 See what interests you
- Topic
29k Popularity
29k Popularity
146k Popularity
4k Popularity
18k Popularity
Who to follow
More
HuageFinancialResearch
2023 Peak Streamer Competition 2nd place, 5 years of live streaming experience, professional analysis of alts market and contract current price orders, trying to help brothers minimize pitfalls and avoid detours.
BitcoinLord
Welcome new fren to join the master
GateLive
Streamer Exclusive Benefits
1. Live mining program- Enjoy up to 70% commission
2.Official support plan
3.Double commission(60 days), VIP+1, etc.
CoinLeader
The market itself has never fluctuated; the price movements observed are merely the emotions of the participants. Once the mind is calm, the price fluctuations become invisible, and only trends and signals are seen.
JinLunSpeaks
Futures short-term trading, primarily focusing on ETH. Holdings leverage is 50 times, maximum holdings 30%, the minimum order amount for futures trading starts from 100u, with strict take profit and stop loss!
No record
- Pin
- 🎉 Hey Gate Square friends! Non-stop perks and endless excitement—our hottest posting reward events are ongoing now! The more you post, the more you win. Don’t miss your exclusive goodies! 🚀
🆘 #Gate 2025 Semi-Year Community Gala# | Square Content Creator TOP 10
Only 1 day left! Your favorite creator is one vote away from TOP 10. Interact on Square to earn Votes—boost them and enter the prize draw. Prizes: iPhone 16 Pro Max, Golden Bull sculpture, Futures Vouchers!
Details 👉 https://www.gate.com/activities/community-vote
1️⃣ #Show My Alpha Points# | Share your Alpha points & gains
Post your - 💙 Gate Square #Gate Blue Challenge# 💙
Show your limitless creativity with Gate Blue!
📅 Event Period
August 11 – 20, 2025
🎯 How to Participate
1. Post your original creation (image / video / hand-drawn art / digital work, etc.) on Gate Square, incorporating Gate’s brand blue or the Gate logo.
2. Include the hashtag #Gate Blue Challenge# in your post title or content.
3. Add a short blessing or message for Gate in your content (e.g., “Wishing Gate Exchange continued success — may the blue shine forever!”).
4. Submissions must be original and comply with community guidelines. Plagiarism or re