ART vs DYDX: A Battle of Decentralized Trading Platforms in the Crypto Arena
Introduction: ART vs DYDX Investment Comparison
In the cryptocurrency market, the comparison between ART and DYDX has always been a topic that investors can't ignore. The two not only have significant differences in market cap ranking, application scenarios, and price performance, but also represent different positioning in the crypto asset space.
LiveArt (ART): Since its launch, it has gained market recognition for its AI-powered RWAfi protocol aimed at unlocking the $10T market of investment-grade art and collectibles.
dYdX (DYDX): Since its inception, it has been hailed as a decentralized derivatives trading protocol, becoming one of the most traded and valued cryptocurrencies globally.
This article will comprehensively analyze the investment value comparison between ART and DYDX, focusing on historical price trends, supply mechanisms, institutional adoption, technical ecosystems, and future predictions, attempting to answer the question investors care about most:
"Which is the better buy right now?"
I. Price History Comparison and Current Market Status
LiveArt (ART) and dYdX (DYDX) Historical Price Trends
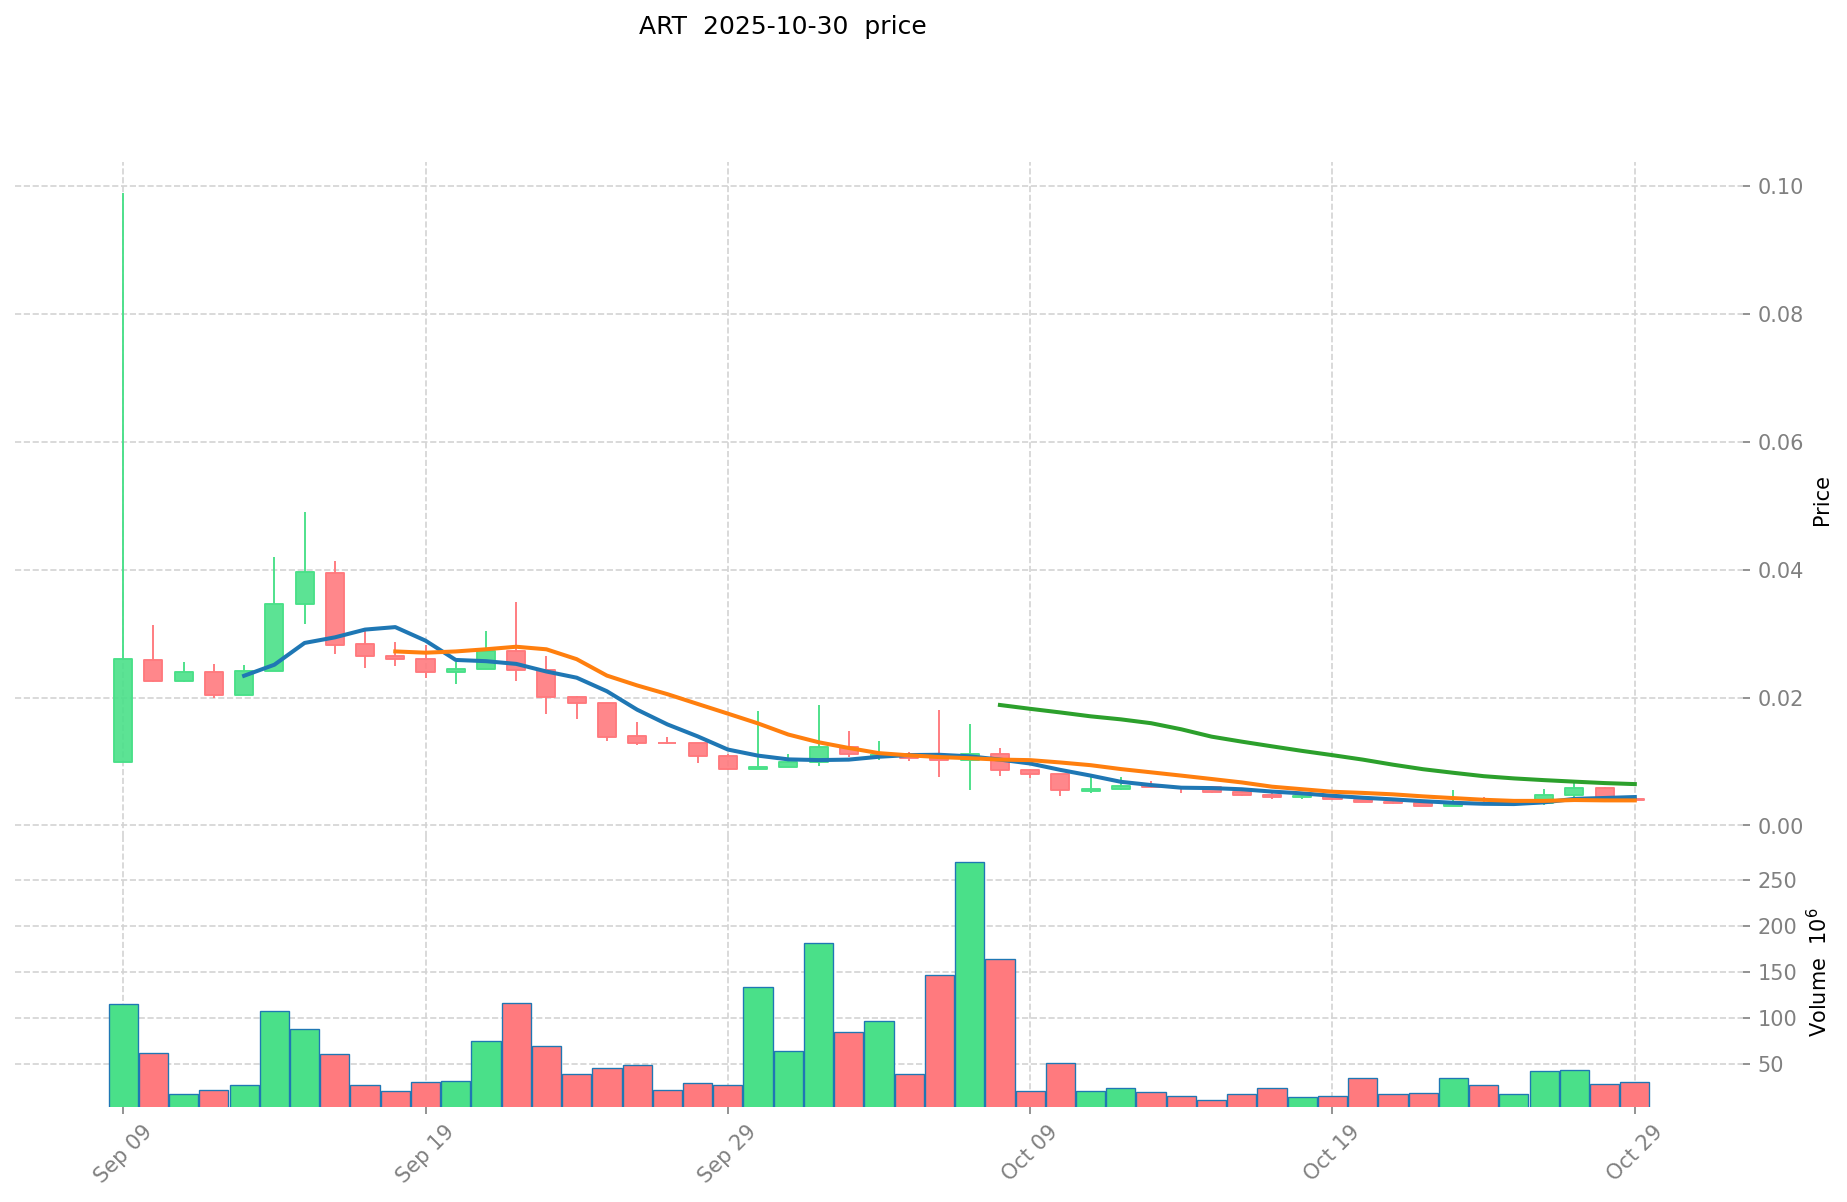
- 2025: ART reached an all-time high of $0.099 on September 9, 2025.
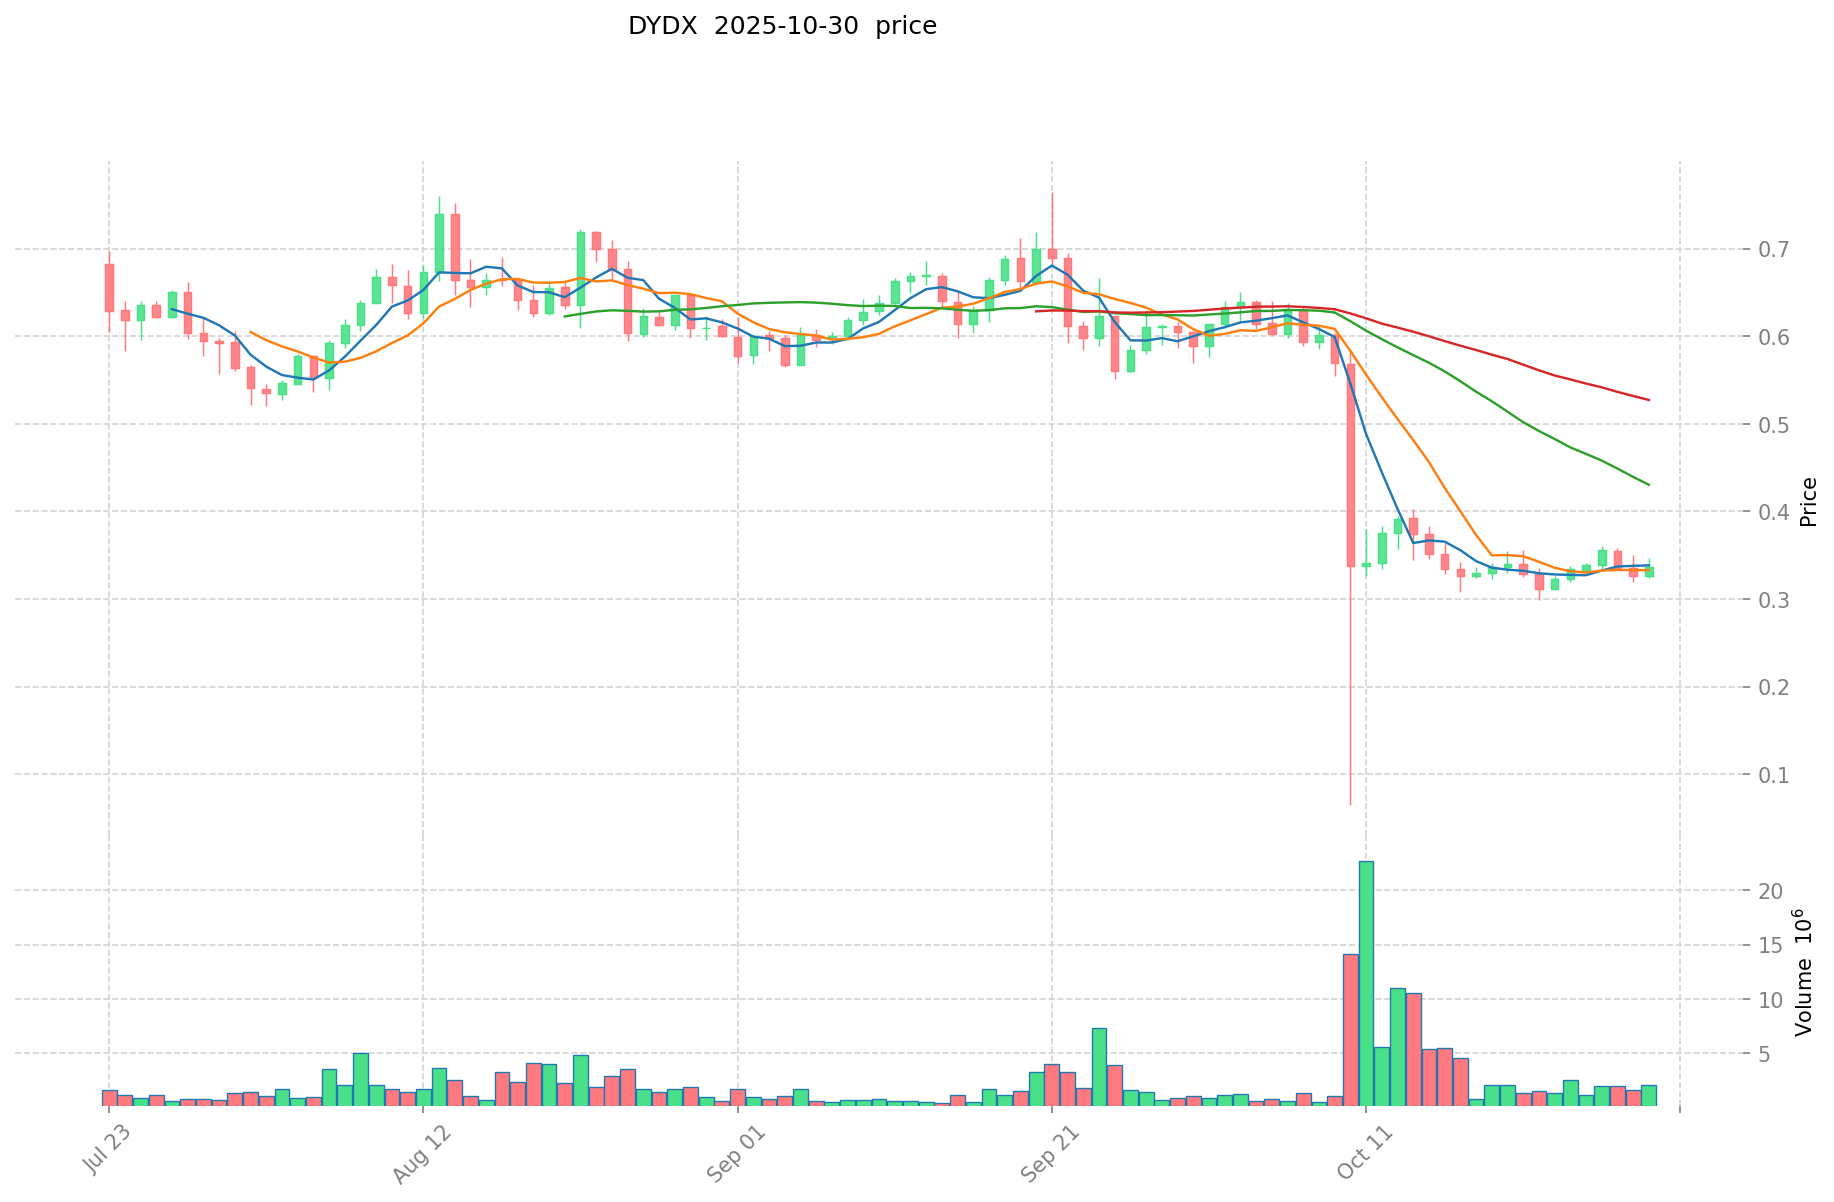
- 2025: DYDX hit an all-time high of $4.52 on March 8, 2024, but has since experienced a significant decline.
- Comparative analysis: In the recent market cycle, ART dropped from its high of $0.099 to a low of $0.003002, while DYDX fell from $4.52 to $0.126201.
Current Market Situation (2025-10-31)
- ART current price: $0.003238
- DYDX current price: $0.3016
- 24-hour trading volume: ART $122,130.27 vs DYDX $1,525,718.99
- Market Sentiment Index (Fear & Greed Index): 34 (Fear)
Click to view real-time prices:
- View ART current price Market Price
- View DYDX current price Market Price
Investment Value Core Factors: ART vs DYDX
Supply Mechanism Comparison (Tokenomics)
- DYDX: Implemented trading mining model that drove initial token price and market cap growth
- ART: Currently lacks profitability as a key investment factor
- 📌 Historical pattern: Both tokens face challenges in creating sustainable value through their supply mechanics
Institutional Adoption & Market Application
- Institutional holdings: DYDX has demonstrated stronger institutional interest through its v4.0 platform
- Enterprise adoption: DYDX positions itself as a benchmark in the DEX sector with advanced security mechanisms and transparent governance
- Regulatory stance: Both tokens operate in sectors currently facing profitability challenges within the DeFi ecosystem
Technical Development & Ecosystem Building
- DYDX technical upgrades: v4.0 introduces robust security mechanisms, transparent governance model, and optimized user experience
- ART technical development: Insufficient data on specific technical advancements
- Ecosystem comparison: DYDX shows stronger ecosystem development, focusing on creating greater value for users and community
Macroeconomic & Market Cycles
- Performance during market trends: Current market trends suggest continued growth for L1 smart contract platforms while DeFi sectors struggle with profitability
- Monetary policy impact: Both tokens operate in sectors that haven't yet demonstrated consistent profitability
- Cross-border factors: DYDX appears better positioned through its ecosystem-building efforts to adapt to changing market conditions
III. 2025-2030 Price Prediction: ART vs DYDX
Short-term Prediction (2025)
- ART: Conservative $0.002608 - $0.00326 | Optimistic $0.00326 - $0.0043358
- DYDX: Conservative $0.284525 - $0.2995 | Optimistic $0.2995 - $0.32346
Mid-term Prediction (2027)
- ART may enter a growth phase, with estimated prices ranging from $0.004405564 to $0.00603562268
- DYDX may enter a steady growth phase, with estimated prices ranging from $0.3706612 to $0.459619888
- Key drivers: Institutional capital inflow, ETFs, ecosystem development
Long-term Prediction (2030)
- ART: Base scenario $0.006451870279239 - $0.007355132118332 | Optimistic scenario $0.007355132118332+
- DYDX: Base scenario $0.4620202899312 - $0.632967797205744 | Optimistic scenario $0.632967797205744+
Disclaimer: The above predictions are based on historical data and market analysis. Cryptocurrency markets are highly volatile and subject to change. This information should not be considered as financial advice. Always conduct your own research before making investment decisions.
ART:
| 年份 | 预测最高价 | 预测平均价格 | 预测最低价 | 涨跌幅 |
|---|---|---|---|---|
| 2025 | 0.0043358 | 0.00326 | 0.002608 | 0 |
| 2026 | 0.005013228 | 0.0037979 | 0.001974908 | 17 |
| 2027 | 0.00603562268 | 0.004405564 | 0.00405311888 | 36 |
| 2028 | 0.0059514764076 | 0.00522059334 | 0.0036022094046 | 61 |
| 2029 | 0.007317705684678 | 0.0055860348738 | 0.003184039878066 | 72 |
| 2030 | 0.007355132118332 | 0.006451870279239 | 0.003806603464751 | 99 |
DYDX:
| 年份 | 预测最高价 | 预测平均价格 | 预测最低价 | 涨跌幅 |
|---|---|---|---|---|
| 2025 | 0.32346 | 0.2995 | 0.284525 | 0 |
| 2026 | 0.4298424 | 0.31148 | 0.2741024 | 3 |
| 2027 | 0.459619888 | 0.3706612 | 0.292822348 | 22 |
| 2028 | 0.46910881472 | 0.415140544 | 0.38192930048 | 37 |
| 2029 | 0.4819159005024 | 0.44212467936 | 0.3625422370752 | 46 |
| 2030 | 0.632967797205744 | 0.4620202899312 | 0.286452579757344 | 53 |
IV. Investment Strategy Comparison: ART vs DYDX
Long-term vs Short-term Investment Strategies
- ART: Suitable for investors focused on RWAfi and art market potential
- DYDX: Suitable for investors interested in decentralized derivatives trading
Risk Management and Asset Allocation
- Conservative investors: ART: 30% vs DYDX: 70%
- Aggressive investors: ART: 60% vs DYDX: 40%
- Hedging tools: Stablecoin allocation, options, cross-currency portfolios
V. Potential Risk Comparison
Market Risk
- ART: Limited market adoption and liquidity in the RWAfi sector
- DYDX: Volatility in the derivatives trading market
Technical Risk
- ART: Scalability, network stability
- DYDX: Smart contract vulnerabilities, platform security
Regulatory Risk
- Global regulatory policies may have differing impacts on both tokens, particularly in the DeFi and RWAfi sectors
VI. Conclusion: Which Is the Better Buy?
📌 Investment Value Summary:
- ART advantages: Unique positioning in the RWAfi market, potential for growth in the art and collectibles sector
- DYDX advantages: Established presence in decentralized derivatives trading, ongoing technical upgrades
✅ Investment Advice:
- New investors: Consider a balanced approach with a slight preference for DYDX due to its more established market presence
- Experienced investors: Explore opportunities in both tokens, with a focus on DYDX for short-term trading and ART for long-term potential
- Institutional investors: Evaluate DYDX for its institutional-grade features and liquidity, while monitoring ART for future developments in the RWAfi space
⚠️ Risk Warning: The cryptocurrency market is highly volatile. This article does not constitute investment advice. None
FAQ
Q1: What are the key differences between ART and DYDX? A: ART is focused on the RWAfi (Real World Asset) market, particularly in art and collectibles, while DYDX is a decentralized derivatives trading protocol. ART aims to unlock the $10T market of investment-grade art, while DYDX has become one of the most traded cryptocurrencies globally.
Q2: How do their current market prices compare? A: As of October 31, 2025, ART's price is $0.003238, while DYDX's price is $0.3016. DYDX has a significantly higher trading volume at $1,525,718.99 compared to ART's $122,130.27 in the last 24 hours.
Q3: What are the long-term price predictions for ART and DYDX? A: By 2030, ART is predicted to reach between $0.006451870279239 and $0.007355132118332 in the base scenario, with potential for higher in an optimistic scenario. DYDX is predicted to reach between $0.4620202899312 and $0.632967797205744 in the base scenario, also with potential for higher in an optimistic scenario.
Q4: How do their supply mechanisms compare? A: DYDX implemented a trading mining model that initially drove token price and market cap growth. ART currently lacks profitability as a key investment factor. Both tokens face challenges in creating sustainable value through their supply mechanics.
Q5: Which token has shown stronger institutional adoption? A: DYDX has demonstrated stronger institutional interest, particularly through its v4.0 platform. It positions itself as a benchmark in the DEX sector with advanced security mechanisms and transparent governance.
Q6: What are the main risks associated with investing in ART and DYDX? A: For ART, risks include limited market adoption and liquidity in the RWAfi sector, as well as scalability and network stability issues. For DYDX, risks involve volatility in the derivatives trading market and potential smart contract vulnerabilities. Both face regulatory risks, particularly in the DeFi and RWAfi sectors.
Q7: Which token might be better for different types of investors? A: New investors might consider a balanced approach with a slight preference for DYDX due to its more established market presence. Experienced investors could explore opportunities in both, using DYDX for short-term trading and ART for long-term potential. Institutional investors might evaluate DYDX for its institutional-grade features while monitoring ART for future developments in the RWAfi space.
Share
Content
Introduction: ART vs DYDX Investment Comparison
I. Price History Comparison and Current Market Status
Investment Value Core Factors: ART vs DYDX
III. 2025-2030 Price Prediction: ART vs DYDX
IV. Investment Strategy Comparison: ART vs DYDX
V. Potential Risk Comparison
VI. Conclusion: Which Is the Better Buy?
FAQ

