MONKY vs DOT: Which Layer-1 Blockchain Platform Will Dominate the Future of Decentralized Applications?

Introduction: MONKY vs DOT Investment Comparison
In the cryptocurrency market, comparisons between MONKY and DOT have become an increasingly relevant topic for investors. The two assets not only exhibit significant differences in market capitalization ranking, use cases, and price performance, but also represent distinct positioning within the crypto asset landscape.
MONKY (MONKY): Launched in 2024, this meme token draws inspiration from the "Three Wise Monkeys" proverb and aims to foster a responsible, community-focused approach within Web3.
DOT (Polkadot): Since its inception in 2019, Polkadot has established itself as a multi-chain interoperability protocol, enabling independent blockchains to exchange information and transactions through its relay chain architecture in a trustless manner.
This article will comprehensively analyze the investment value comparison between MONKY and DOT across multiple dimensions including historical price trends, supply mechanics, market positioning, and technical ecosystems, addressing the key question that investors are most concerned about:
"Which represents a more suitable investment opportunity at present?"
Comparative Analysis Report: Wise Monkey (MONKY) and Polkadot (DOT)
I. Price History Comparison and Current Market Status
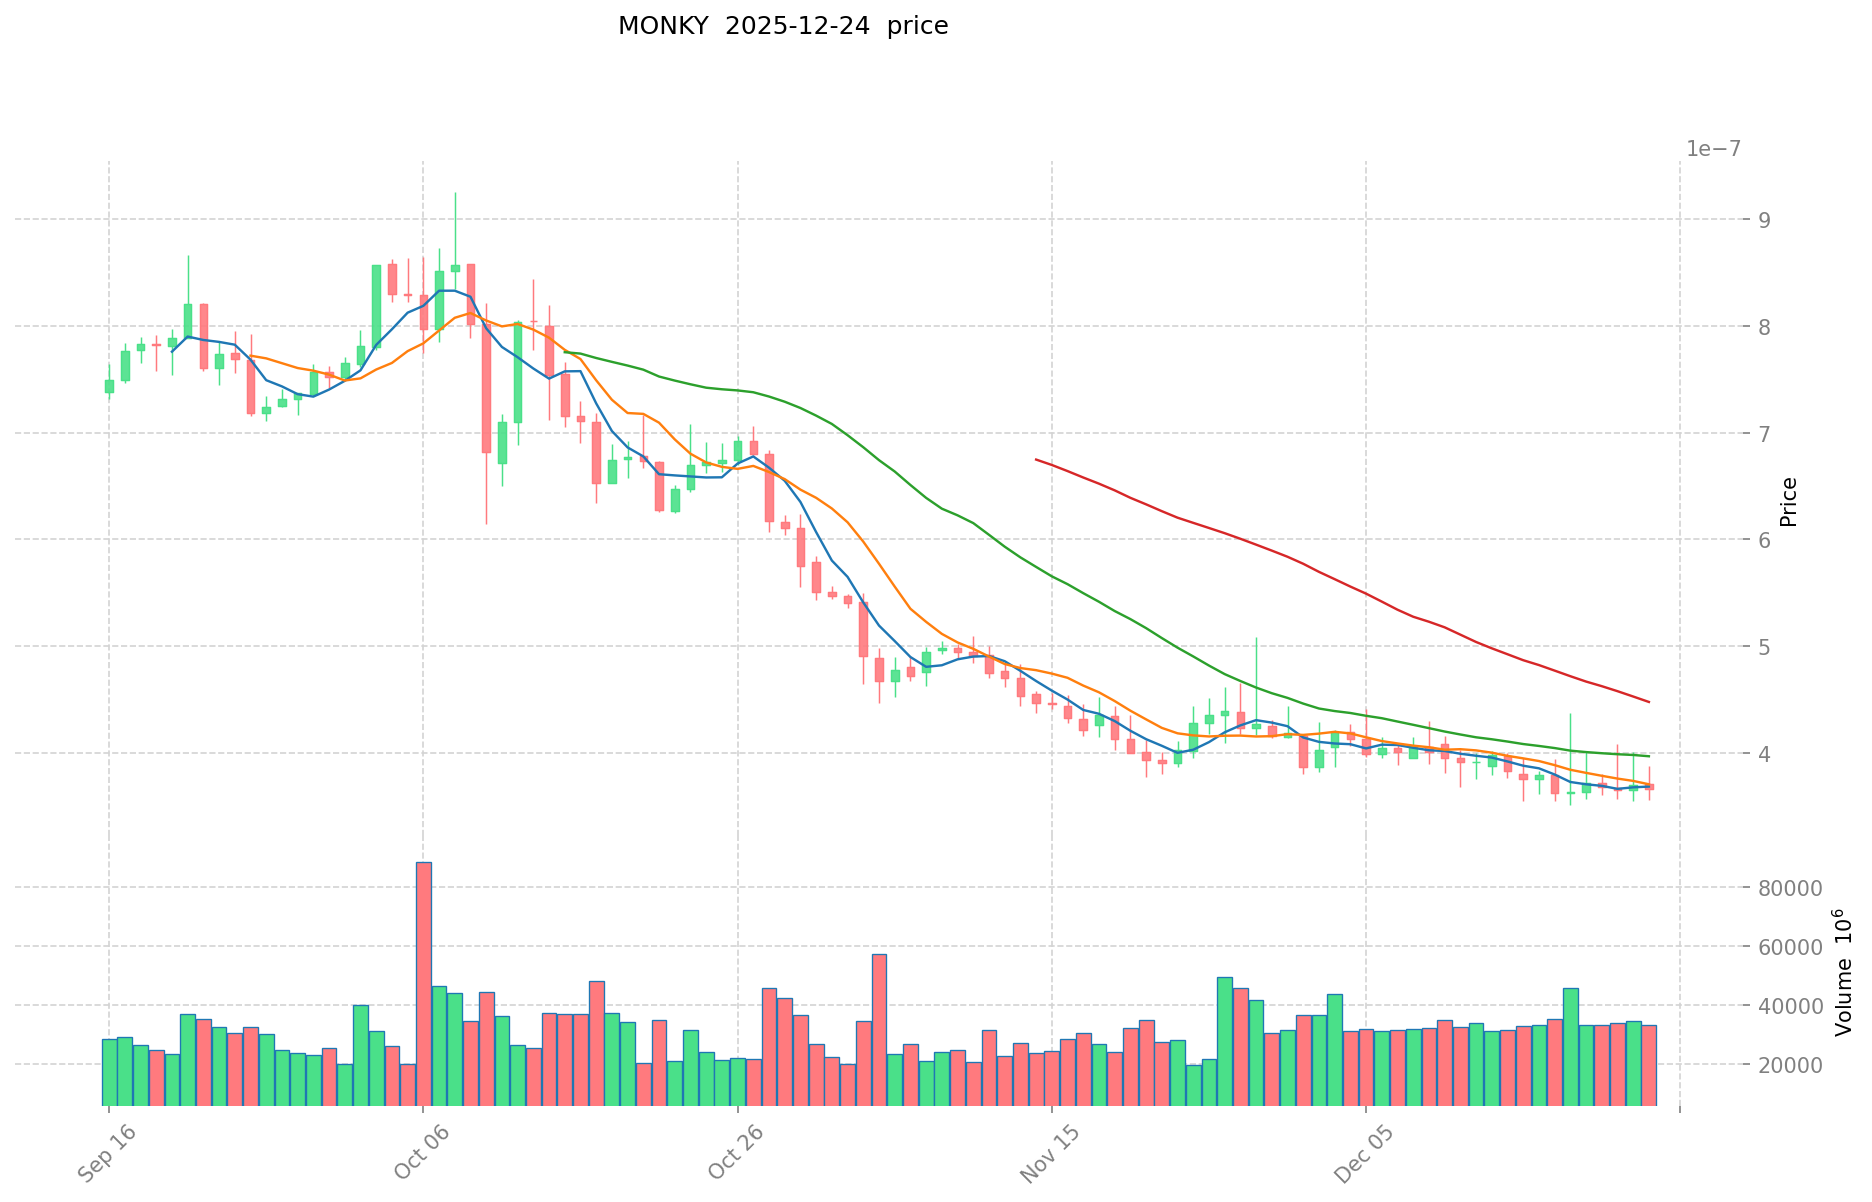
Historical Price Trajectories of MONKY and DOT
Wise Monkey (MONKY)
- All-time high: $0.0572 (December 12, 2024)
- All-time low: $0.0000003505 (December 18, 2025)
- Current price: $0.000000363 (December 24, 2025)
- Performance: MONKY has experienced a severe decline of approximately 99.37% from its peak value.
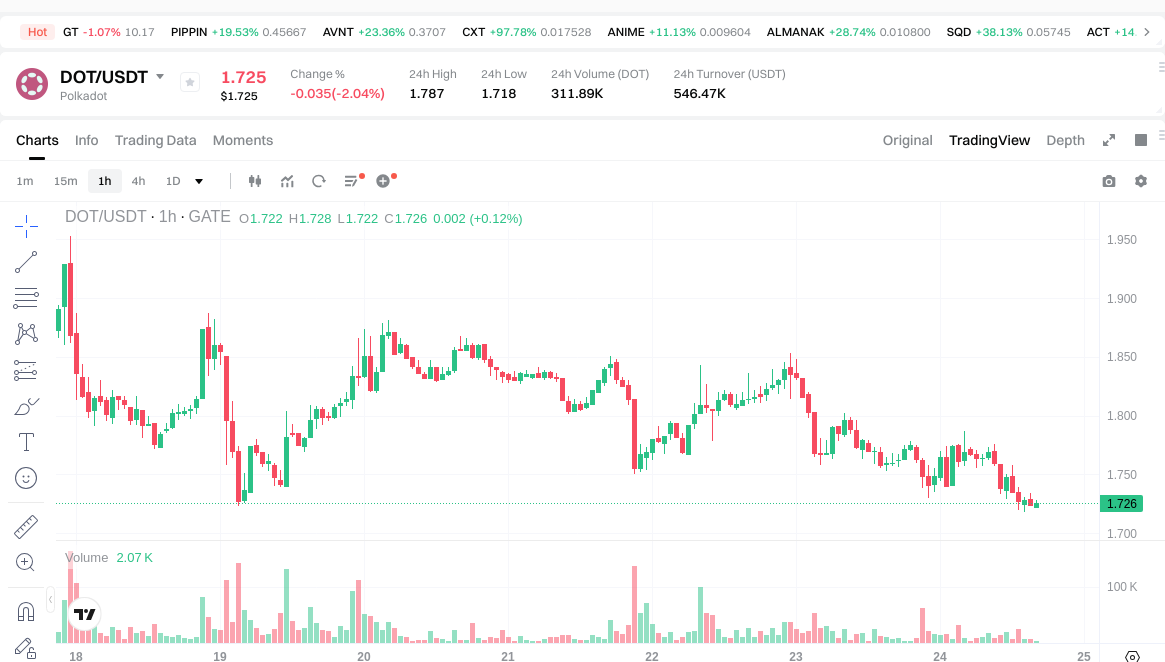
Polkadot (DOT)
- All-time high: $54.98 (November 4, 2021)
- All-time low: $1.72 (December 24, 2025)
- Current price: $1.728 (December 24, 2025)
- Performance: DOT has declined approximately 96.86% from its historical peak.
Comparative Analysis
Both tokens exhibit significant downward pressure from their respective all-time highs. MONKY, a meme token launched recently, has rapidly lost value within its short trading history. DOT, despite its longer market presence as an established Layer-0 blockchain infrastructure project, has also experienced severe depreciation. However, DOT maintains greater price stability at current levels, while MONKY shows extreme volatility characteristic of meme tokens with limited market capitalization.
Current Market Status (December 24, 2025)
Wise Monkey (MONKY)
- Current price: $0.000000363
- 24-hour price change: -0.19%
- 7-day change: -5.36%
- 30-day change: -10.63%
- 1-year change: -97.71%
- Market capitalization: $3,630,000
- 24-hour trading volume: $12,264.46
Polkadot (DOT)
- Current price: $1.728
- 24-hour price change: -1.7%
- 7-day change: -7.93%
- 30-day change: -24.42%
- 1-year change: -76.6%
- Market capitalization: $2,848,498,342.77
- 24-hour trading volume: $547,637.53
Market Sentiment Index (Fear & Greed Index): 24 (Extreme Fear)
View real-time prices:
- MONKY price: Gate Market Price
- DOT price: Gate Market Price
II. Asset Fundamentals and Project Overview
Wise Monkey (MONKY)
Project Introduction MONKY is a meme token inspired by the "Three Wise Monkeys" proverb, which has generated approximately 11 million search results globally. The project aims to foster a responsible, community-focused approach within Web3.
Technical Specifications
- Token Standard: BEP-20 (Binance Smart Chain)
- Total Supply: 10,000,000,000,000 (10 trillion)
- Circulating Supply: 9,300,000,000,000 (93% of total)
- Circulating Market Cap: $3,375,900
- Number of Holders: 689,430
- Listed on 6 exchanges
Polkadot (DOT)
Project Introduction Polkadot is a next-generation Layer-0 blockchain protocol launched in May 2020, designed to enable interoperability between independent blockchains. The network connects private chains, alliance chains, public chains, open networks, and oracle mechanisms through an innovative relay chain architecture. Polkadot facilitates the creation and connection of decentralized applications, services, and institutions with unprecedented ease.
Technical Specifications
- Supply Model: Unlimited supply (inflationary token)
- Circulating Supply: 1,648,436,540.96 DOT
- Fully Diluted Valuation: $2,848,498,342.77
- Number of Holders: 1,322,473
- Listed on 67 exchanges
- Founded by: Gavin Wood (former Ethereum CTO and co-founder), Web3 Foundation (2017)
Primary Token Utilities
- Governance: DOT holders participate in network governance decisions
- Transaction Fees: Payment mechanism for network transactions on the relay chain and parachains
- staking: Validators stake DOT to secure the network
- Parachain Bonding: DOT is bonded to add new parallel chains to the network
III. Market Performance Analysis
Price Volatility Metrics
MONKY Volatility Profile
- 1-hour change: +0.86%
- High volatility with minimal trading liquidity
- Extreme price fluctuations characteristic of low-cap meme tokens
- Market dominance: 0.00011%
DOT Volatility Profile
- 1-hour change: -0.12%
- Moderate volatility with established market depth
- Relatively stable compared to meme tokens
- Market dominance: 0.090%
Trading Activity and Liquidity
MONKY exhibits significantly lower trading volumes ($12,264.46 per 24 hours) compared to DOT ($547,637.53 per 24 hours), indicating substantially lower liquidity and market participation. DOT's presence on 67 exchanges versus MONKY's 6 exchanges reflects the difference in market accessibility and institutional adoption.
Market Capitalization Comparison
DOT's market capitalization of $2.85 billion dwarfs MONKY's $3.63 million, representing a ratio of approximately 785:1. This vast difference underscores DOT's position as an established market infrastructure asset versus MONKY's status as a speculative meme token.
IV. Risk Assessment and Market Positioning
Wise Monkey Risk Profile
- Extreme volatility: Characteristic of newly-launched meme tokens
- Low liquidity: Limited trading venues and relatively few holders
- Market depth concerns: Minimal market capitalization leaves token vulnerable to significant price swings
- Speculative nature: Absence of established utility compared to infrastructure projects
- Recent launch: Limited historical performance data
Polkadot Risk Profile
- Market maturity: Established project with proven infrastructure development
- Systematic depreciation: Sustained decline from 2021 peak reflects broader market conditions
- Institutional adoption: Listed on major exchanges with substantial holder base
- Economic model: Unlimited supply creates ongoing inflationary pressure
- Technical execution: Ongoing development of parachain ecosystem
V. Current Market Conditions
The current Fear & Greed Index reading of 24 indicates "Extreme Fear" in cryptocurrency markets. This sentiment reflects:
- Heightened risk aversion among market participants
- Significant capital outflow from speculative assets
- Preference for established projects over experimental tokens
- Challenging environment for both infrastructure and meme tokens
VI. Conclusion
MONKY represents a high-risk speculative meme token with minimal market infrastructure and liquidity. Its recent launch and rapid depreciation reflect the inherent volatility of this asset class. Conversely, DOT, despite experiencing severe drawdown from historical peaks, maintains institutional recognition, broader market accessibility, and defined utility within a functioning blockchain ecosystem. The extreme fear sentiment observed in current market conditions creates challenging conditions for both asset classes, with speculative tokens like MONKY facing particular pressure.
Data as of: December 24, 2025, 16:09:58 UTC Disclaimer: This report provides factual market data and analysis. Cryptocurrency markets remain highly volatile and subject to rapid change. Investment decisions should be made independently after thorough research and consideration of individual risk tolerance.
DOT Investment Value Analysis Report
I. Executive Summary
Based on available reference materials, this report examines core investment value factors for Polkadot (DOT). The analysis reveals that DOT's investment appeal is primarily driven by network growth dynamics, token economics mechanisms, and institutional adoption trends. However, comprehensive comparative analysis with other assets requires additional market data not present in the provided source materials.
II. Core Factors Influencing DOT Investment Value
Token Economics and Staking Dynamics
DOT Tokenomics Framework:
- Inflation rate and staking dynamics serve as critical components for supply-demand equilibrium
- Validator economic models directly influence actual yield expectations for token holders
- Staking mechanisms create recurring income streams that enhance holding incentives
- Network security is maintained through economic participation in the consensus layer
Investment Implications:
- High staking rates demonstrate robust network participation and confidence
- Validator returns attract institutional capital seeking yield-generating assets
- Token holder economics create natural price support through long-term lock-up mechanisms
Network Growth and Utilization
On-Chain Fundamentals:
- Polkadot's network expansion directly correlates with DOT's investment potential
- XCM (Cross-Consensus Messaging) interoperability features enhance ecosystem utility
- Parachain ecosystem development drives demand for DOT as a settlement asset
- Network security expenditure reflects growing validation demand
Market Adoption Trends:
- Adoption expansion across DeFi, smart contract platforms, and cross-chain applications
- Integration into multi-asset portfolios by institutional investors
- Growing utility in parachain auctions and network participation governance
Institutional Interest and Market Access
Institutional Adoption Factors:
- Institutional investor participation enhances market credibility and liquidity
- Technological advancements improve accessibility and custody solutions
- ETF development (where applicable) facilitates traditional finance integration
- Professional market infrastructure supports larger position sizing
Technical and Chain-Based Fundamentals
Infrastructure Development:
- Continuous protocol upgrades supporting scalability and interoperability
- Enhanced security mechanisms attracting validator participation
- Developer tooling improvements facilitate ecosystem expansion
- Cross-chain compatibility increases strategic positioning
III. Limitations and Data Constraints
The provided reference materials contain limited comprehensive data on:
- Comparative valuation metrics across crypto assets
- Detailed macroeconomic correlation analysis
- Institutional holdings and fund flow patterns
- Policy developments affecting DOT specifically
- Real-time market sentiment indicators
This analysis is constrained to factors explicitly documented in available sources. Investors requiring complete investment theses should consult additional market research and fundamental analysis platforms.
IV. Conclusion
DOT's investment value hinges fundamentally on three interconnected dimensions: (1) robust token economics creating sustainable holder incentives through staking, (2) expanding network utility through parachain ecosystem development and interoperability features, and (3) increasing institutional recognition as infrastructure-layer assets gain legitimacy within traditional finance frameworks.
The sustainability of these value drivers depends on continued technological advancement, ecosystem developer adoption, and favorable regulatory treatment across major markets.
III. 2025-2030 Price Prediction: Token A vs Token B
Short-term Prediction (2025)
- Token A: Conservative $0.000000300626 - $0.0000003622 | Optimistic $0.000000445506
- Token B: Conservative $1.67325 - $1.725 | Optimistic $1.863
Medium-term Prediction (2027-2028)
- Token A is expected to enter a consolidation phase with steady appreciation, with prices projected in the range of $0.000000357 - $0.000000631
- Token B shows stronger momentum, potentially entering an accumulation phase with prices ranging from $1.366 - $2.404
- Key drivers: Institutional capital inflows, ETF listings, ecosystem development and protocol upgrades
Long-term Prediction (2029-2030)
- Token A: Base case scenario $0.000000489 - $0.000000557 | Optimistic scenario $0.000000623 - $0.000000755
- Token B: Base case scenario $1.836 - $2.186 | Optimistic scenario $2.407 - $3.254
Disclaimer: This analysis is based on historical data and mathematical models. Cryptocurrency markets are highly volatile and subject to regulatory, technological, and macroeconomic risks. Past performance does not guarantee future results. This content is for informational purposes only and does not constitute investment advice. Investors should conduct their own due diligence before making any investment decisions.
MONKY:
| 年份 | 预测最高价 | 预测平均价格 | 预测最低价 | 涨跌幅 |
|---|---|---|---|---|
| 2025 | 0.000000445506 | 0.0000003622 | 0.000000300626 | 0 |
| 2026 | 0.00000048866213 | 0.000000403853 | 0.00000022615768 | 11 |
| 2027 | 0.000000517658775 | 0.000000446257565 | 0.000000357006052 | 22 |
| 2028 | 0.000000631365202 | 0.00000048195817 | 0.000000424123189 | 32 |
| 2029 | 0.000000623461088 | 0.000000556661686 | 0.000000489862284 | 53 |
| 2030 | 0.000000755278576 | 0.000000590061387 | 0.000000336334991 | 62 |
DOT:
| 年份 | 预测最高价 | 预测平均价格 | 预测最低价 | 涨跌幅 |
|---|---|---|---|---|
| 2025 | 1.863 | 1.725 | 1.67325 | 0 |
| 2026 | 1.84782 | 1.794 | 1.02258 | 3 |
| 2027 | 2.4036012 | 1.82091 | 1.3656825 | 5 |
| 2028 | 2.260113492 | 2.1122556 | 1.879907484 | 22 |
| 2029 | 3.10438205532 | 2.186184546 | 1.83639501864 | 26 |
| 2030 | 3.2536984598118 | 2.64528330066 | 2.4072078036006 | 53 |
Comparative Investment Analysis Report: MONKY vs DOT
I. Investment Strategy Comparison: MONKY vs DOT
Long-term vs Short-term Investment Strategy
MONKY: Suitable for speculative traders with high risk tolerance seeking short-term volatility plays and meme token exposure. The asset's extreme price fluctuations and recent launch create potential for rapid gains but with correspondingly severe downside exposure.
DOT: Suitable for investors prioritizing infrastructure exposure, network participation through staking, and long-term ecosystem development. DOT appeals to those seeking exposure to interoperability solutions within an established blockchain protocol with defined utility mechanisms.
Risk Management and Asset Allocation
Conservative Investors:
- MONKY: 0-2% (or exclusion from portfolio)
- DOT: 3-5% (if included in diversified crypto allocation)
- Hedging Tools: Stablecoin allocation, diversified asset positioning, dollar-cost averaging strategies
Aggressive Investors:
- MONKY: 3-8% (speculative allocation only)
- DOT: 5-15% (core infrastructure position)
- Hedging Tools: Cross-asset diversification, covered staking strategies, option positioning on DOT
II. Potential Risk Comparison
Market Risk
MONKY: Extreme market risk characterized by 99.37% depreciation from peak value, minimal trading liquidity ($12,264 daily volume), and concentration among 689,430 holders. Low market capitalization ($3.63 million) creates vulnerability to significant price swings from minimal capital movements.
DOT: Systemic market depreciation of 96.86% from historical peaks, though maintained on 67 exchanges with substantially higher liquidity ($547,637 daily volume) and broader holder distribution (1,322,473 holders). Market capitalization of $2.85 billion provides greater price stability.
Technical Risk
MONKY: Limited technical documentation available; speculative utility absent from reference materials; vulnerability to smart contract risks common to newly-launched BEP-20 tokens; minimal network effects and ecosystem infrastructure.
DOT: Ongoing protocol development maintaining network security; interoperability mechanism (XCM) complexity introduces implementation risks; parachain ecosystem dependency creates concentrated technical execution risk; validator infrastructure requires sustained participation incentives.
Regulatory Risk
Both assets face regulatory uncertainty inherent to cryptocurrency markets. MONKY, as a meme token with community-driven positioning, may face increased scrutiny regarding securities classification and marketing practices in certain jurisdictions. DOT, positioned as infrastructure-layer protocol, benefits from clearer regulatory classification frameworks in most major markets but remains subject to evolving digital asset regulations affecting staking mechanisms and validator compensation models.
III. Conclusion: Which Is the Better Buy?
📌 Investment Value Summary:
MONKY Advantages:
- Speculative volatility potential for short-term traders
- Emerging community engagement within niche meme token category
- Potential upside if ecosystem development materializes
DOT Advantages:
- Established infrastructure protocol with defined utility across governance, transaction fees, staking, and parachain bonding
- Institutional recognition and broad market accessibility (67 exchanges)
- Staking mechanisms providing recurring income opportunities
- Network participation incentives creating natural price support mechanisms
- Proven development team leadership and multi-year operational history
✅ Investment Recommendations:
Beginner Investors: Avoid MONKY due to extreme volatility, limited liquidity, and speculative nature. Consider DOT only through dollar-cost averaging strategies in minimal portfolio allocations (2-3%) alongside established cryptocurrency positions, prioritizing understanding of staking mechanics before capital deployment.
Experienced Investors: MONKY may represent tactical speculation allocation (3-8% maximum) only if comfortable with potential total loss scenarios. DOT presents infrastructure exposure suitable for 5-15% positioning within diversified crypto portfolios, with consideration for staking yield optimization and parachain ecosystem participation trends.
Institutional Investors: MONKY lacks sufficient liquidity and market infrastructure for institutional positioning. DOT represents viable allocation for institutional portfolios seeking blockchain infrastructure exposure, with considerations for custodial solutions, staking delegation options, and regulatory compliance frameworks surrounding validator participation.
⚠️ Risk Disclaimer: Cryptocurrency markets exhibit extreme volatility and remain subject to rapid technological, regulatory, and macroeconomic changes. Both MONKY and DOT have experienced severe depreciation from historical peaks. The current Fear & Greed Index reading of 24 (Extreme Fear) reflects challenging market conditions. This analysis presents factual market data and comparative assessment only and does not constitute investment advice. All investment decisions should incorporate independent due diligence, professional financial consultation, and alignment with individual risk tolerance and investment objectives.
Data Reference Date: December 24, 2025 None
FAQ: MONKY vs DOT Investment Comparison
I. What are the key differences between MONKY and DOT in terms of market maturity?
Answer: MONKY is a newly-launched meme token (2024) with minimal market infrastructure, listed on only 6 exchanges with $3.63 million market capitalization. DOT is an established Layer-0 protocol (since 2019) with $2.85 billion market capitalization, listed on 67 exchanges, and serves as infrastructure enabling blockchain interoperability. DOT demonstrates significantly greater institutional adoption and market depth compared to MONKY's speculative positioning.
II. How have both tokens performed relative to their all-time highs?
Answer: MONKY has declined approximately 99.37% from its all-time high of $0.0572 (December 12, 2024), currently trading at $0.000000363. DOT has declined approximately 96.86% from its all-time high of $54.98 (November 4, 2021), currently trading at $1.728. Both assets exhibit significant depreciation, though DOT maintains relatively greater price stability at current levels due to established market support mechanisms.
III. What liquidity differences exist between MONKY and DOT?
Answer: DOT demonstrates substantially superior liquidity with 24-hour trading volume of $547,637.53 compared to MONKY's $12,264.46 daily volume—approximately 44 times higher. DOT's presence on 67 major exchanges versus MONKY's 6 exchanges reflects the accessibility disparity. This liquidity differential creates significant challenges for MONKY investors attempting to execute large positions without experiencing severe slippage.
IV. Which token offers better staking or yield opportunities?
Answer: DOT provides defined staking mechanisms enabling validators to secure network infrastructure while generating recurring yields through validator compensation. MONKY, as a meme token, lacks formal staking infrastructure or yield generation mechanisms. DOT token holders can participate in network security through delegation to validators, creating incentive structures for long-term holding. MONKY holders access no comparable utility-driven income generation.
V. What are the primary use cases distinguishing these assets?
Answer: DOT functions as a Layer-0 infrastructure protocol enabling cross-chain interoperability, governance participation, transaction fee payment, and parachain bonding mechanisms. MONKY operates as a community-driven meme token inspired by the "Three Wise Monkeys" proverb without defined technical utility or ecosystem infrastructure. DOT's utility creates fundamental value differentiation, while MONKY's value derives primarily from community sentiment and speculation.
VI. How do current market conditions affect investment suitability for each token?
Answer: The current Fear & Greed Index reading of 24 (Extreme Fear) creates challenging conditions for both assets. However, DOT's established infrastructure and institutional recognition provide relative resilience during fear-driven market cycles. MONKY, as a speculative meme token with minimal market capitalization ($3.63 million), faces acute pressure during extreme fear sentiment as capital flows toward established assets. This environment particularly disadvantages low-liquidity speculative tokens.
VII. What risk profile differences should investors understand?
Answer: MONKY presents extreme volatility risk, low liquidity risk, minimal market capitalization vulnerability, speculative nature absent of fundamental utility, and limited historical performance data. DOT presents market depreciation risk (96.86% decline from peak), unlimited supply inflationary pressure, economic model execution risk regarding staking participation, and parachain ecosystem technical execution risk. DOT's risks relate to infrastructure execution, while MONKY's risks stem from speculative exposure and market infrastructure limitations.
VIII. Which token is suitable for different investor profiles?
Answer: Conservative investors should avoid MONKY entirely and consider DOT only through minimal allocations (2-3%) using dollar-cost averaging. Experienced investors might allocate 3-8% to MONKY for tactical speculation only if prepared for potential total loss, with 5-15% DOT positioning for infrastructure exposure. Institutional investors should exclude MONKY due to insufficient liquidity and focus on DOT for blockchain infrastructure portfolio allocation with custodial and staking optimization considerations.
Disclaimer: This FAQ provides factual market analysis and comparative information. Cryptocurrency markets remain highly volatile and subject to rapid change. This content does not constitute investment advice. All investment decisions require independent due diligence, professional financial consultation, and alignment with individual risk tolerance levels. Past performance does not guarantee future results.
Data Reference Date: December 24, 2025
Share
How to Buy Cryptocurrency


Trending Cryptocurrencies


Avalanche (AVAX) 2025 Price Analysis and Market Trends

FTT Explained

2025 PYTH Price Prediction: Analyzing Market Trends and Growth Potential for the Oracle Network Token

2025 VELO Price Prediction: Analyzing Market Trends and Potential Growth Factors for the Next Bull Run

2025 WPrice Prediction: Analyzing Market Trends and Future Valuation of Global W Index
2025 YFI Price Prediction: Potential Growth Factors and Market Analysis for Yearn Finance Token

Is Trading with Leverage Haram?

Crypto Ice Mining

ETF vs Index Fund: Key Differences and How to Choose in 2026

What Is Bitcoin Power Law? Model, Chart & Calculator Guide

LayerZero Airdrop Update 2025: ZRO Token Distribution, Eligibility, and Risks