Why is the crypto market continuing to fall despite the Federal Reserve's continuous interest rate cuts?
TL;DR
Recent market downturns have been driven by temporary macro headwinds, the unexpected market disruption on October 11, and intensified capital competition among U.S., South Korean, and Chinese stock markets. Over the long run, the Federal Reserve’s cautious and moderate rate cuts and moderate liquidity injections have failed to generate enough buying momentum to counteract selling pressure from the steady flow of new crypto asset issuances and token unlocks. This dynamic increases overall crypto market capitalization, but most token prices decline, leaving secondary market investors in a bear market environment.
In the short term, watch for the timing of the U.S. government reopening and the effective date for the conclusion of Federal Reserve balance sheet reduction (December 1, UTC). In the long term, monitor the pace of rate cuts and the competition for capital between crypto and other risk asset markets.
1. Crypto Market Cap Rises with Easing Liquidity, but Heavy Asset Supply Weighs on Prices
1. Crypto Market Cap Growth Closely Tracks Global Risk Asset Trends Over the Long Term
Global liquidity cycles directly impact major risk assets. A comparison of total crypto market capitalization and U.S. equity market capitalization reveals a strong long-term correlation in rise-and-fall patterns.
The chart below illustrates the past year:
Red line: Total crypto market cap
Green line: Altcoin market cap, excluding BTC and ETH
Blue line: S&P 500 Index performance
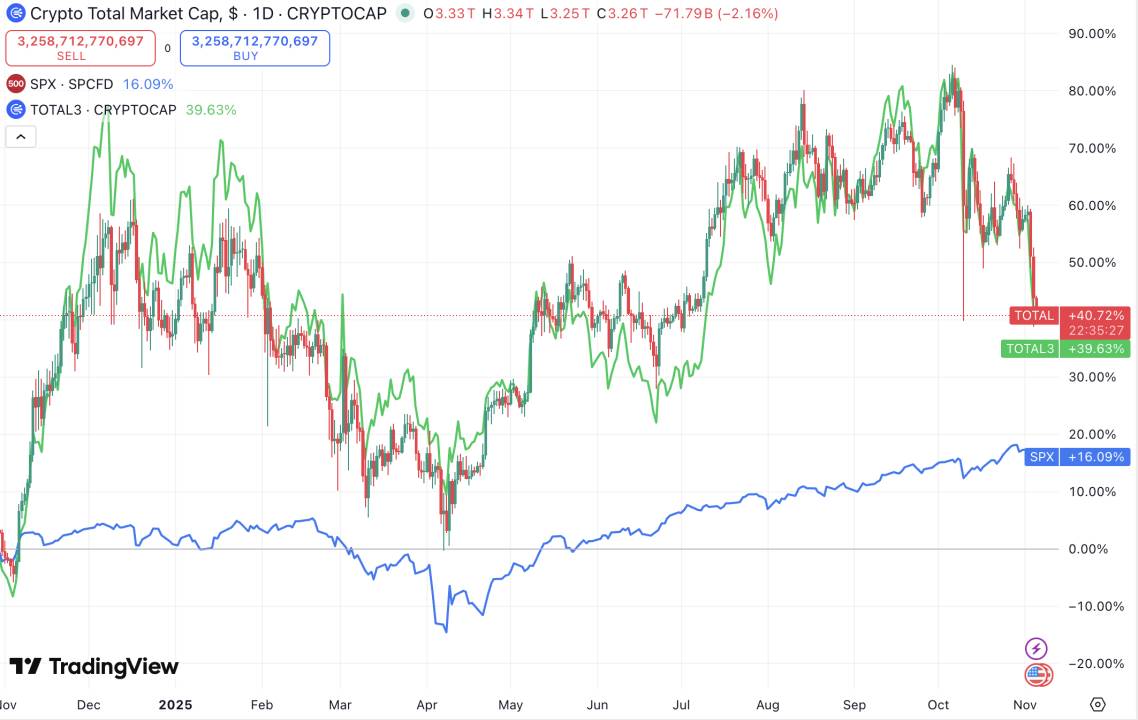
2024.11-2025.11 Total, Total3 & SPX
Source: TradingView
Key observations:
- Crypto market cap has outpaced U.S. equities.
- All three generally move in sync, bottom out, and restart rallies—though the October 11 black swan event temporarily disrupted this synchronicity (not discussed here).
2. Massive Asset Issuance Drives Altcoin Market Cap Up While Token Prices Fall
Market cap growth doesn’t guarantee investor profits. Over the past year, new crypto asset launches and peak token unlocks—especially from projects started during the 2021–2023 cycle in public chains, DeFi, and AI—have put steady selling pressure on the market. Tokenmist data shows roughly $30 billion in new token unlocks over the past three months.
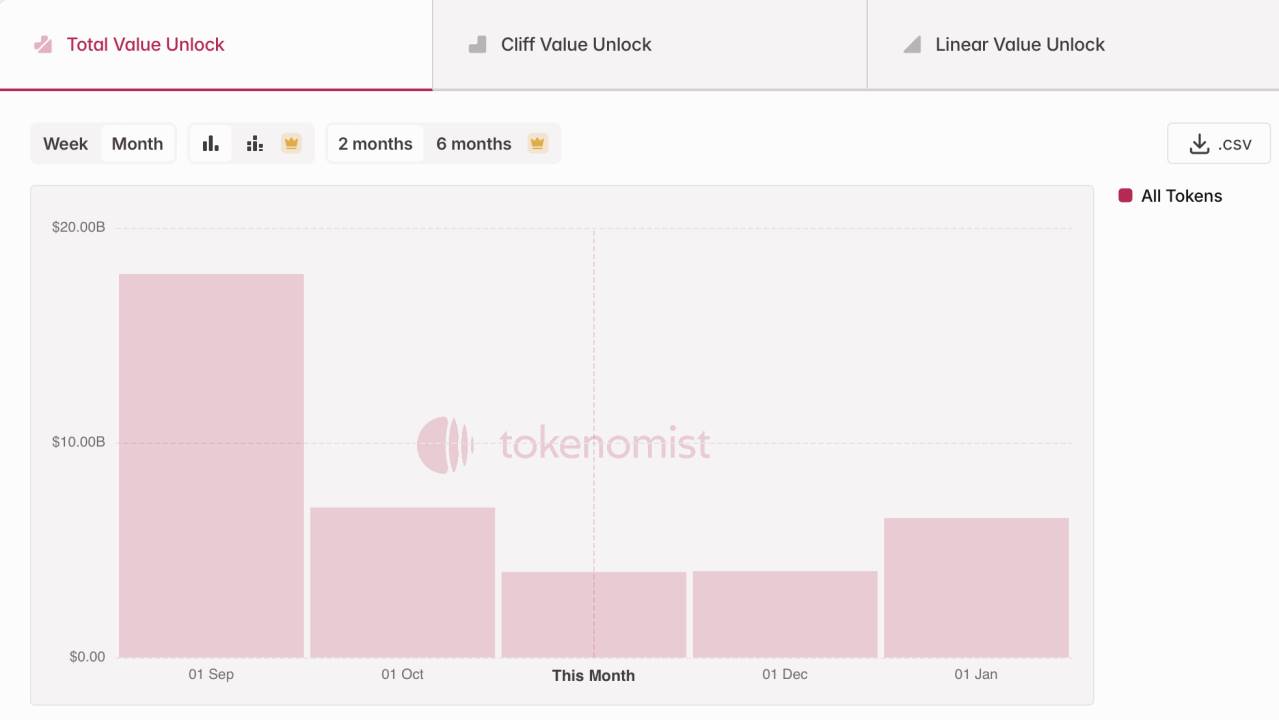
Approx. $30 billion in token unlocks in the past three months
Source: Tokenmist
To sum up: The Federal Reserve’s cautious and moderate rate cuts and liquidity injections have not produced enough buying pressure to overcome the selling caused by new crypto issuances and unlocks. This is reflected in rising total market cap but falling individual token prices, resulting in secondary market bear conditions for investors.
2. Short-Term Macro Liquidity Faces Temporary Headwinds
On a long-term basis, the trend remains historically accommodative on both monetary and fiscal fronts. In the short term, however, the U.S. government shutdown and the Treasury General Account (TGA) accumulating inflows with no outflows have created fiscal liquidity headwinds, while the slower-than-expected Fed rate cut pace has produced monetary headwinds. Ongoing U.S.-China tensions continue to dampen global risk appetite and influence markets.
The TGA, or Treasury General Account, is the U.S. Treasury’s bank account where proceeds from bond issuance and tax collection are held for fiscal spending, such as payroll or infrastructure. When the TGA balance rises, fiscal funds are locked up and not entering the economy, tightening short-term liquidity. The recent government shutdown amplifies this effect.
1. Fiscal Side: TGA “Inflows Only” Locks Up Funds
Prolonged congressional gridlock over budget appropriations and a record-breaking government shutdown have resulted in fiscal funds flowing in but not out, leading to a temporary liquidity drain. As of October 29, 2025 (UTC), the TGA balance reached $957.8 billion, and on November 4, the U.S. government auctioned another $274 billion in short-term debt.
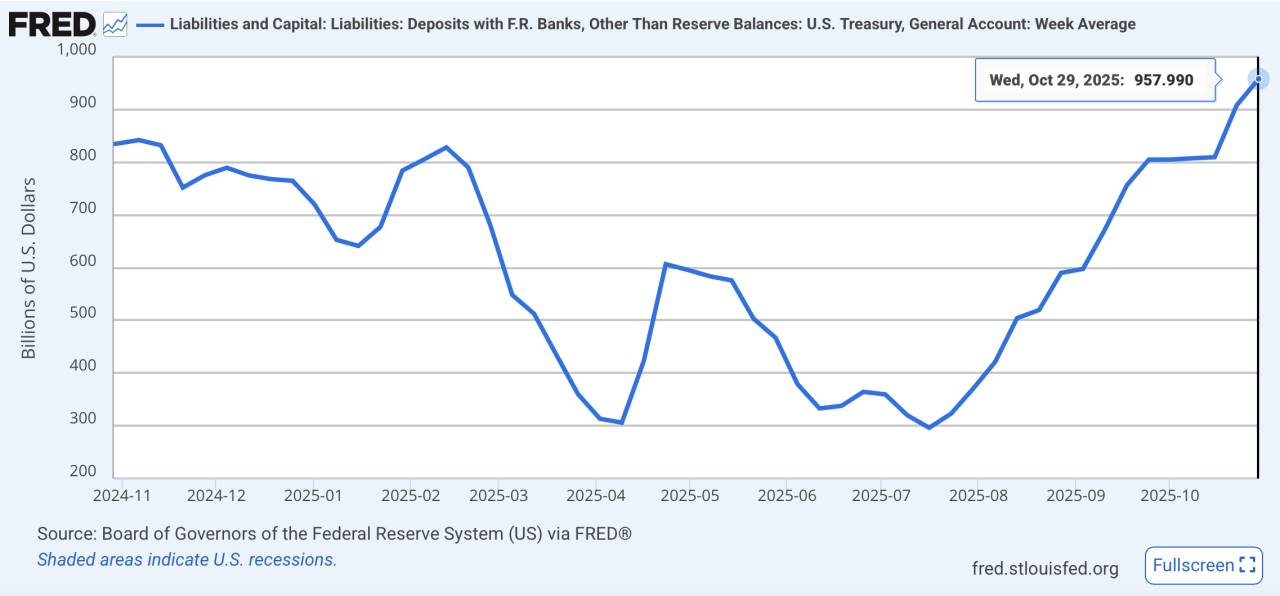
TGA balance hits one-year high
Source: FRED
2. Monetary Side: Rate Cut Pace Falls Short of Expectations
Although the Fed is in a rate-cutting cycle, the pace is much slower than markets anticipated, keeping real rates relatively high. Fed Chair Powell recently declined to commit to a December rate cut at the FOMC meeting, further undermining market confidence. This cautious approach to easing also signals underlying recession concerns.
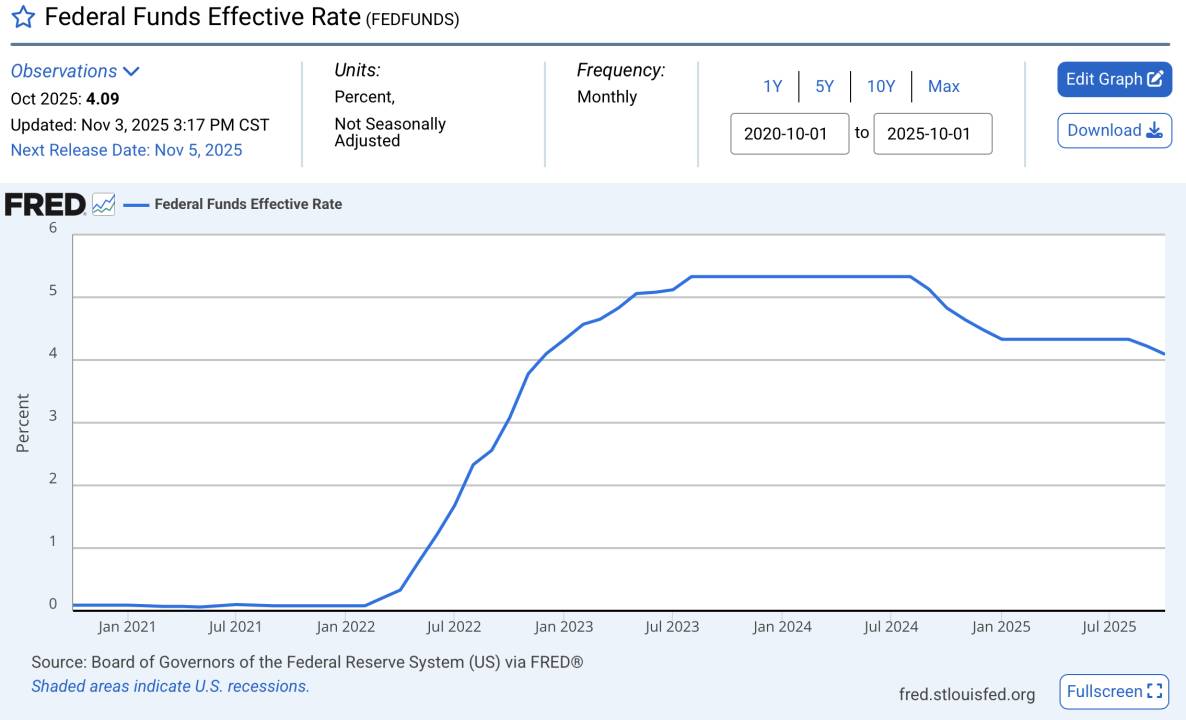
Rates remain historically high
Source: FRED
3. U.S.-China Tension Spurs Risk-Off Sentiment, Weighs on Prices of Risk Assets
Recent developments—including China’s rare earth export restrictions and renewed U.S. tariffs—have intensified risk aversion. The U.S. Dollar Index and equity volatility index have both risen, signaling increased global risk-off sentiment.
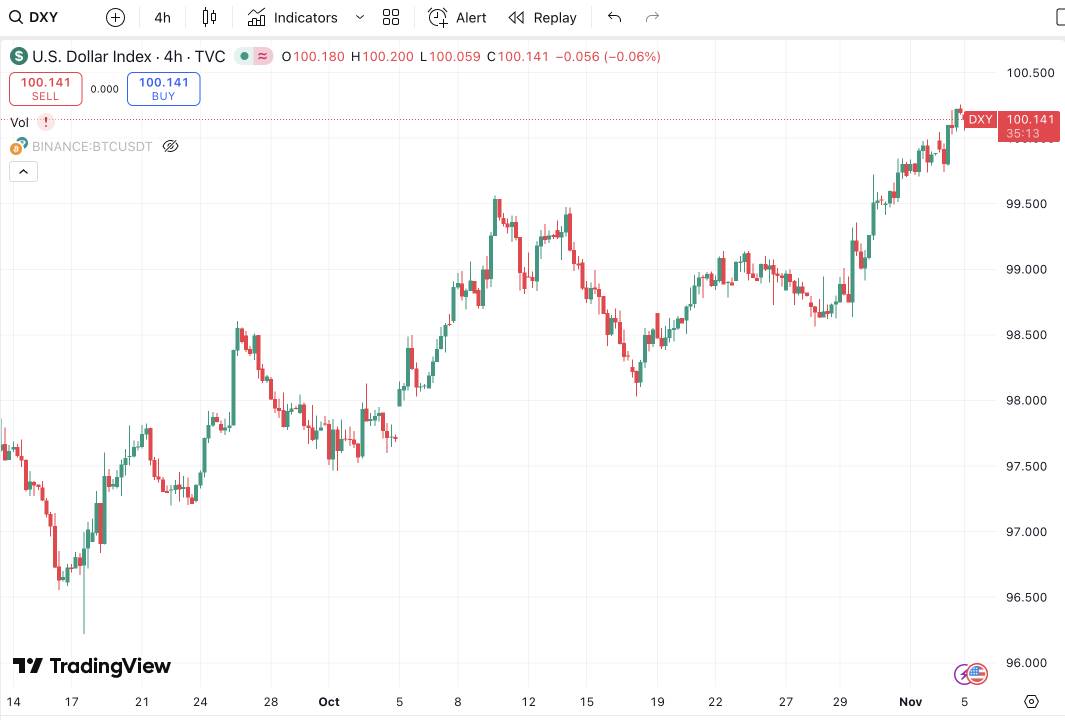
Dollar Index climbs steadily
Source: TradingView

U.S. equity volatility surges
Source: TradingView
3. U.S., China, and South Korea Equity Rallies Draw Risk Capital, Siphoning Funds from Crypto
Bull markets are frequently benchmarked against those of 2021. Back then, aggressive quantitative easing drove a massive liquidity surge, but pandemic-related EPS collapses (company earnings plummeted, making equities unattractive to traders) forced excess liquidity into crypto, sparking a historic bull run. In a year, total crypto market cap jumped from $300 billion to over $3 trillion, with altcoins outperforming BTC and countless small-cap tokens multiplying a hundredfold.
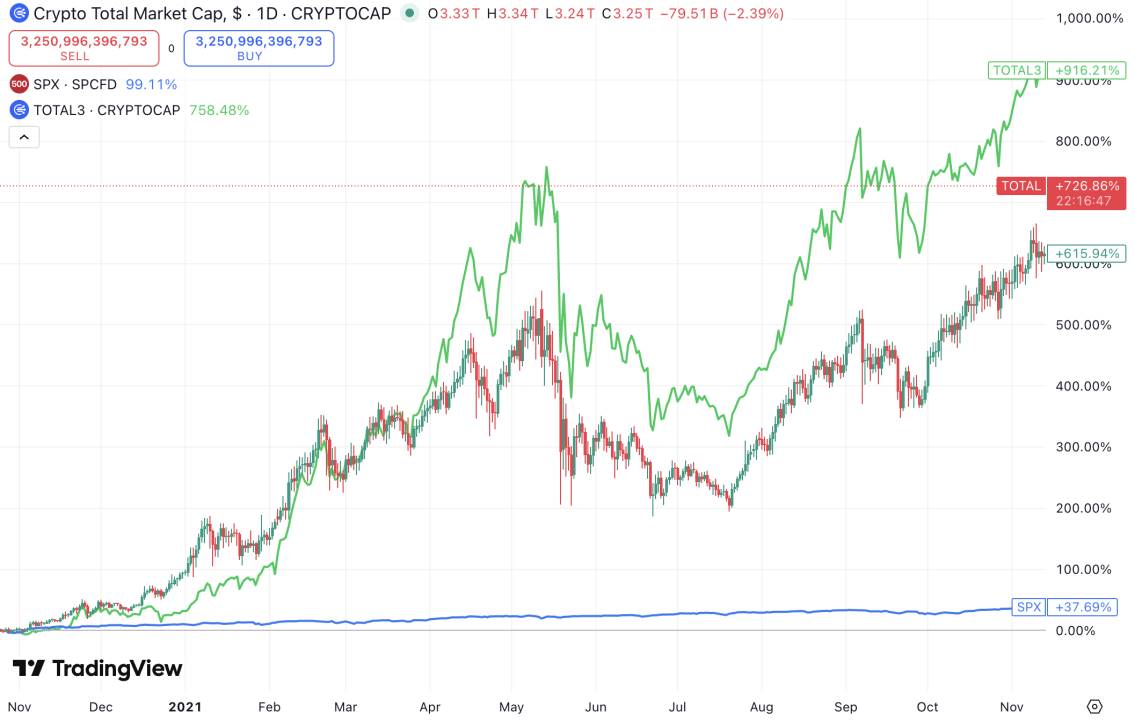
2020.11-2021.11 Total, Total3 & SPX
Source: TradingView
Today, the most influential equity markets—U.S., China, and South Korea—are surging. U.S. stocks are hitting record highs on AI momentum; Chinese A-shares have surpassed 4,000 points, supported by favorable policies and renewed liquidity; and South Korea, powered by a semiconductor export rebound, has seen the KOSPI Index soar nearly 70% year-to-date, making it the top-performing major index in 2025.
Investors increasingly allocate high-risk capital to assets with greater certainty, which significantly diverts liquidity from crypto.
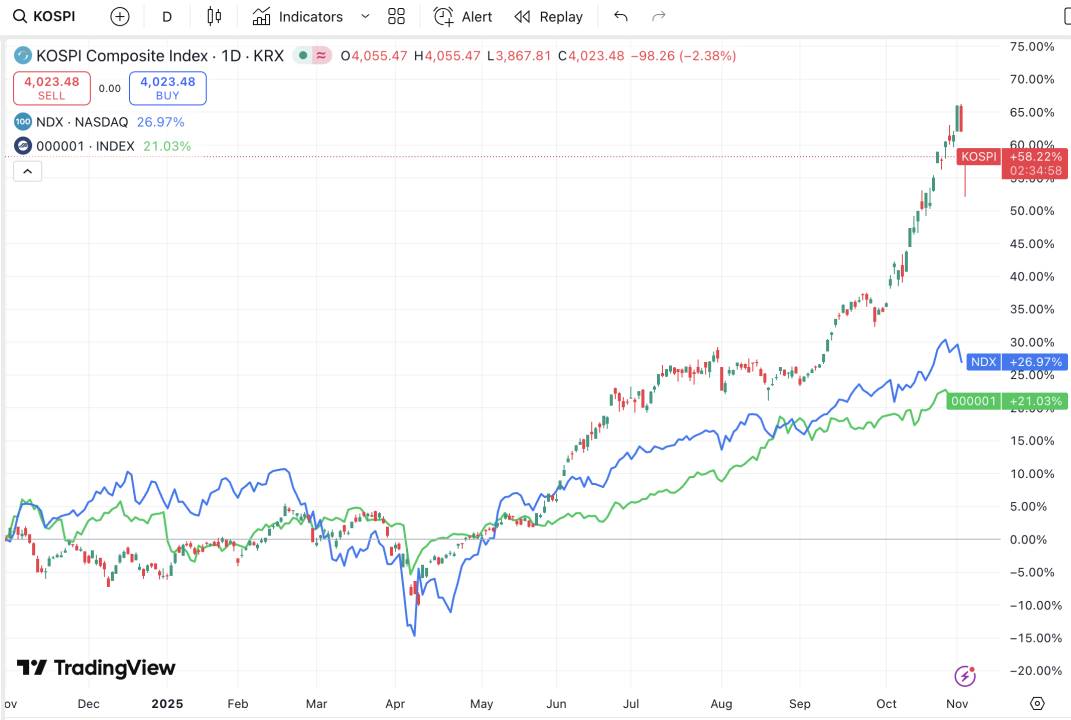
One-year equity gains: South Korea, U.S., China
Source: TradingView
Looking ahead, if global equities continue their rally and Federal Reserve liquidity remains accommodative, crypto is likely to stay “marginalized”—with overall market cap rising but token prices lagging due to constant new issuance. In the near term, monitor the U.S. government reopening and the December 1 (UTC) conclusion of the Federal Reserve’s balance sheet reduction for potential liquidity improvements.
Statement:
- This article is reprinted from [TechFlow]. Copyright belongs to the original author [Yuuki]. For reprint concerns, please contact the Gate Learn team for prompt resolution in accordance with applicable procedures.
- Disclaimer: The opinions expressed herein are those of the author only and do not constitute investment advice.
- Other language versions are translated by the Gate Learn team. Unless Gate is cited, translated articles may not be copied, distributed, or otherwise reproduced.
Share
Content


Related Articles

Reflections on Ethereum Governance Following the 3074 Saga

Gate Research: 2024 Cryptocurrency Market Review and 2025 Trend Forecast

Gate Research: BTC Breaks $100K Milestone, November Crypto Trading Volume Exceeds $10 Trillion For First Time

NFTs and Memecoins in Last vs Current Bull Markets

Gate Research-A Study on the Correlation Between Memecoin and Bitcoin Prices
