Trade
Basic
Futures
Futures
Hundreds of contracts settled in USDT or BTC
Options
HOT
Trade European-style vanilla options
Unified Account
Maximize your capital efficiency
Demo Trading
Futures Kickoff
Get prepared for your futures trading
Futures Events
Futures Mall
Participate in events to win generous rewards
Demo Trading
Use virtual funds to experience risk-free trading
Earn
Launch
CandyDrop
Collect candies to earn airdrops
Launchpool
Quick staking, earn potential new tokens
HODLer Airdrop
Hold GT and get massive airdrops for free
Launchpad
Be early to the next big token project
Alpha Points
NEW
Trade on-chain assets and enjoy airdrop rewards!
Futures Points
NEW
Earn futures points and claim airdrop rewards
Investment
Simple Earn
Earn interests with idle tokens
Auto-Invest
Auto-invest on a regular basis
Dual Investment
Buy low and sell high to take profits from price fluctuations
Soft Staking
Earn rewards with flexible staking
Crypto Loan
0 Fees
Pledge one crypto to borrow another
Lending Center
One-stop lending hub
VIP Wealth Hub
Customized wealth management empowers your assets growth
Private Wealth Management
Customized asset management to grow your digital assets
Quant Fund
Top asset management team helps you profit without hassle
Staking
Stake cryptos to earn in PoS products
Smart Leverage
NEW
No forced liquidation before maturity, worry-free leveraged gains
GUSD Minting
Use USDT/USDC to mint GUSD for treasury-level yields
More
Pummpy
BTC is starting to decline. Will ALTCOIN LIQUIDITY move to BTC #TrumpWithdrawsEUTariffThreats
BTC-1,39%

- Reward
- like
- Comment
- Repost
- Share
#GateTradFi1gGoldGiveaway
My View on Trading TradFi to Earn Gold Every 10 Minutes
Gate has introduced a unique TradFi campaign that combines active trading with tangible real-world rewards. Through the Gate TradFi platform, users can now receive one gold draw every 10 minutes, while daily participation offers the potential to win up to 1,152 grams of gold over the course of the event. This structure is designed to reward consistency, discipline, and intelligent trade execution rather than random or one-time activity.
To participate, users only need to complete a single TradFi trade of at lea

- Reward
- 4
- 5
- Repost
- Share
BeautifulDay :
:
Happy New Year! 🤑View More
Are we still longing this week? 😈$EU
View Original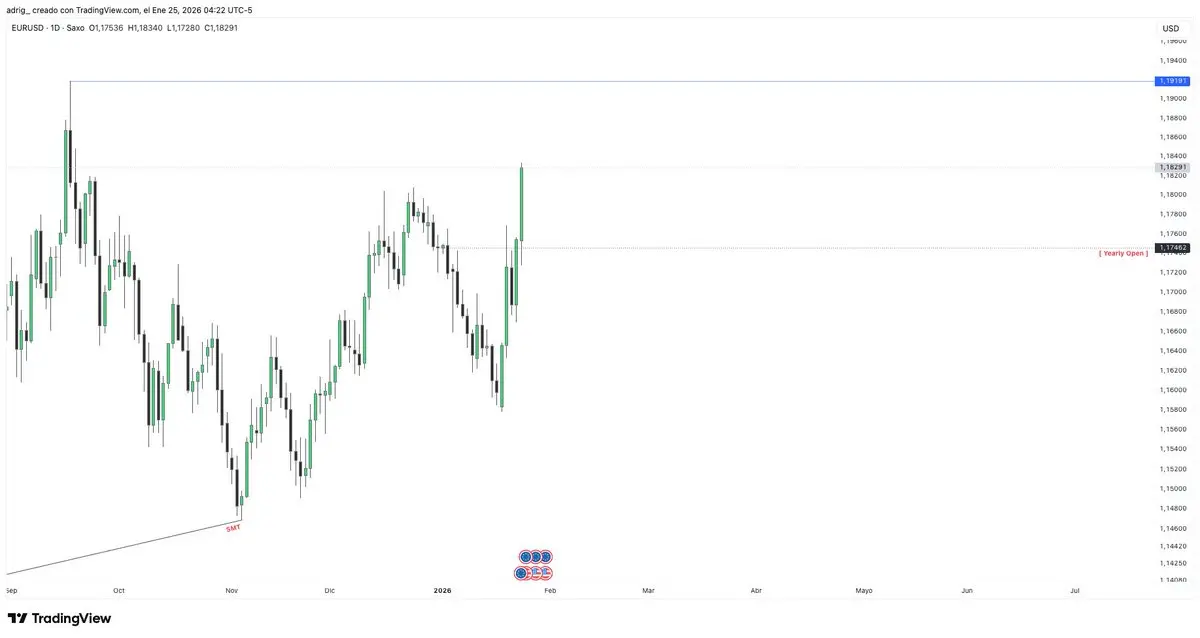
- Reward
- like
- Comment
- Repost
- Share
universecoin
宇宙币
Created By@Universeappl
Subscription Progress
0.00%
MC:
$0
Create My Token
$PI Over twenty languages released simultaneously.
All ecosystems are ready.
Once we get through this period, it will be spring.
Pye is one of my most successful projects, and it will change my life.
From now on, I will stand firm. It’s not easy. But all the hardships and pain are worth it.
The sailor said, what’s a little pain? Wipe away your tears, at least we still have Pye.
I have never felt lost or disappointed. Along the way
PI-1,67%

- Reward
- like
- 2
- Repost
- Share
GateUser-356f2265:
There is also Dragon Blood, brewed for seven springs and autumns, even the stones have melted.View More
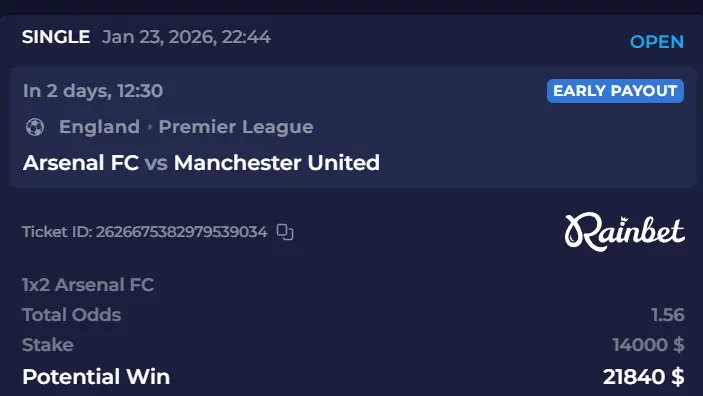
perma punting Arsenal continues
- Reward
- like
- Comment
- Repost
- Share
Happy Sunday guysCan I get a gm

- Reward
- like
- Comment
- Repost
- Share
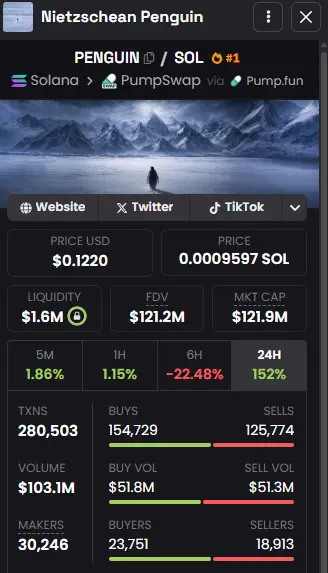
Altcoin Market Overview: Top Movers Today
286
- Reward
- like
- Comment
- Repost
- Share
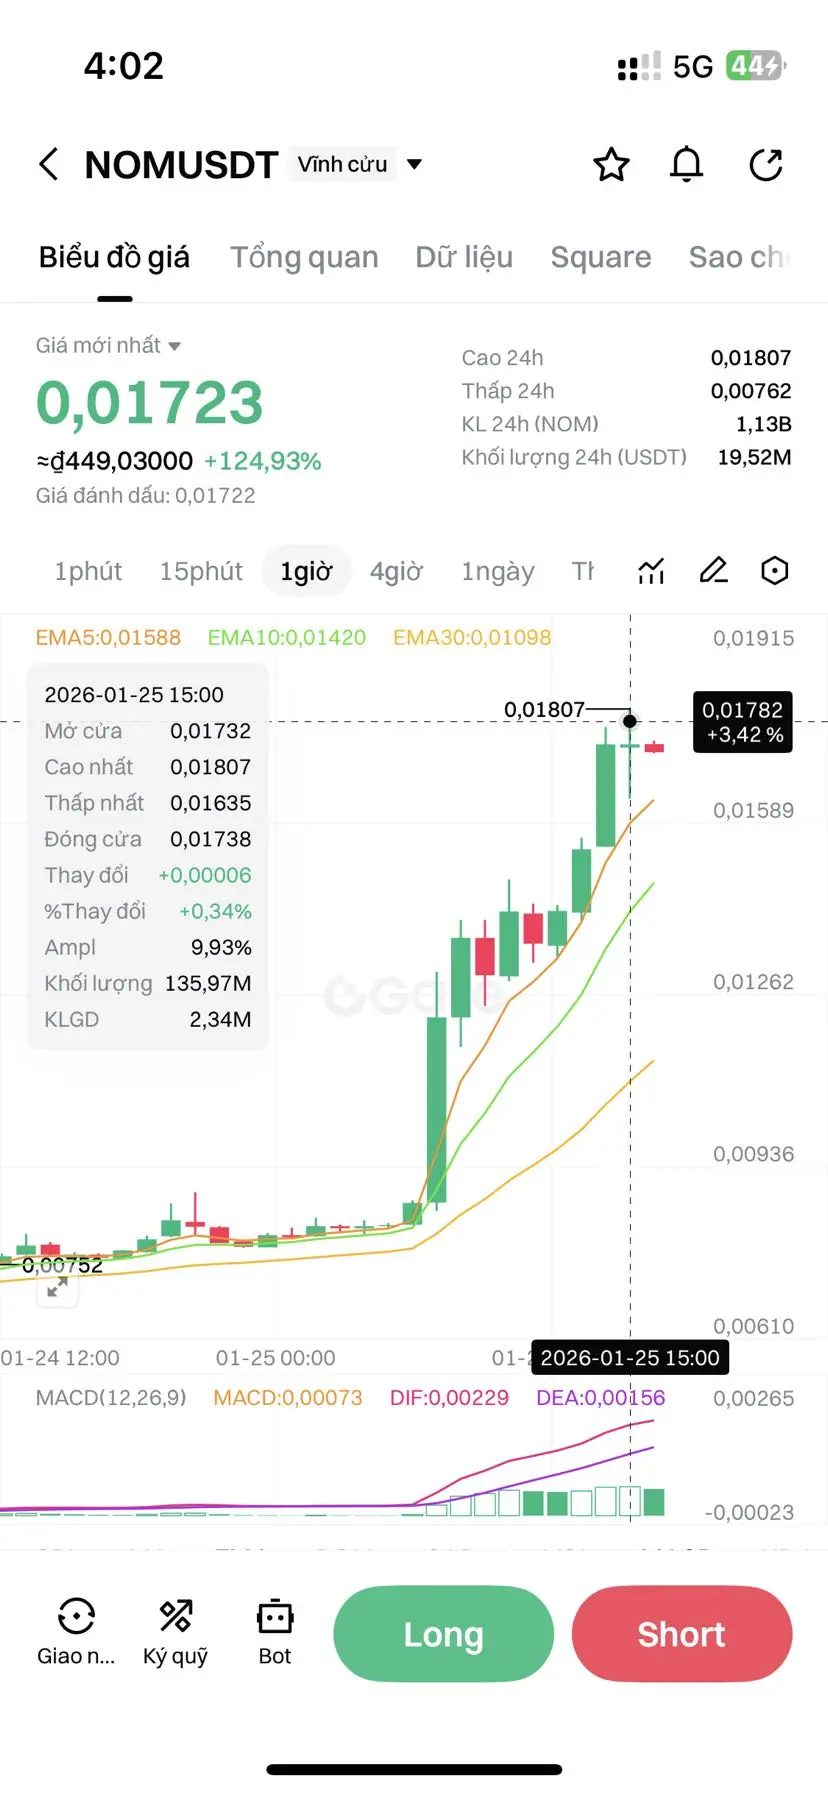
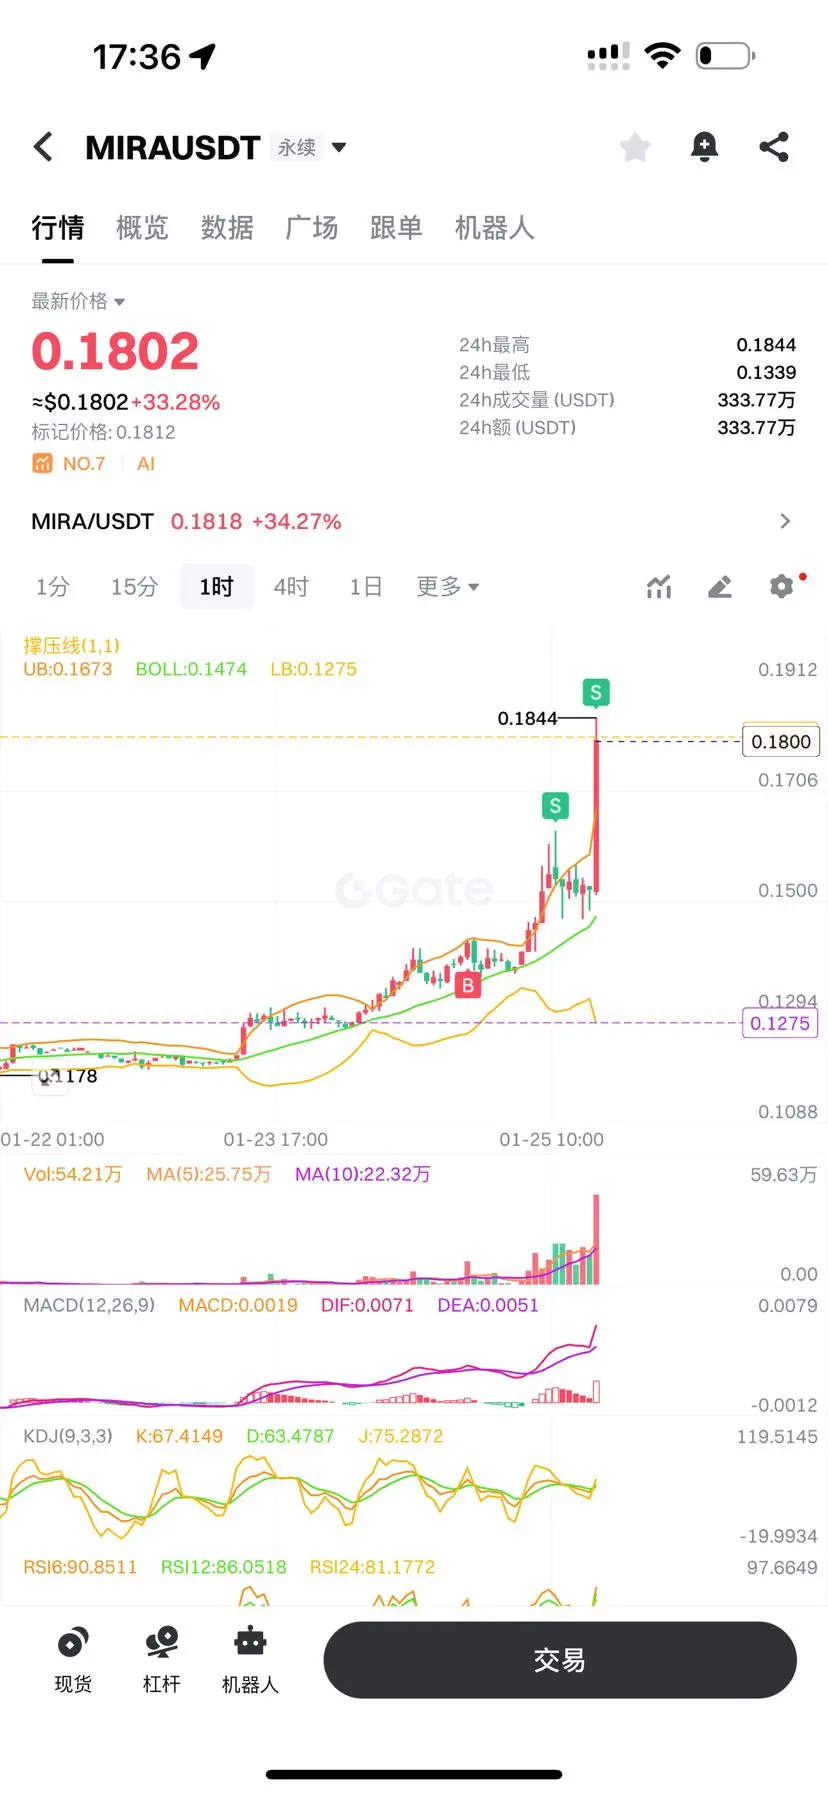
$NOM 🕯️ Why is this a doji sell-off?
• The candle body is very small, with an upper wick appearing
• Located right at the 0.0180–0.0181 peak zone
• Appears after a series of sharply rising candles (+120%/day)
👉 Meaning:
Buyers couldn't push higher,
sellers start to offload.
⸻
🔎 Additional confirmation from indicators
• Volume does not increase with price → weak momentum
• MACD still positive but the slope is slowing down
• Price far from EMA → very likely to be pulled back to equilibrium
➡️ This is a distribution doji, not a pause doji for further pump.
⸻
⏰ Next scenario (high probabi
NOM120,06%
- Reward
- like
- Comment
- Repost
- Share
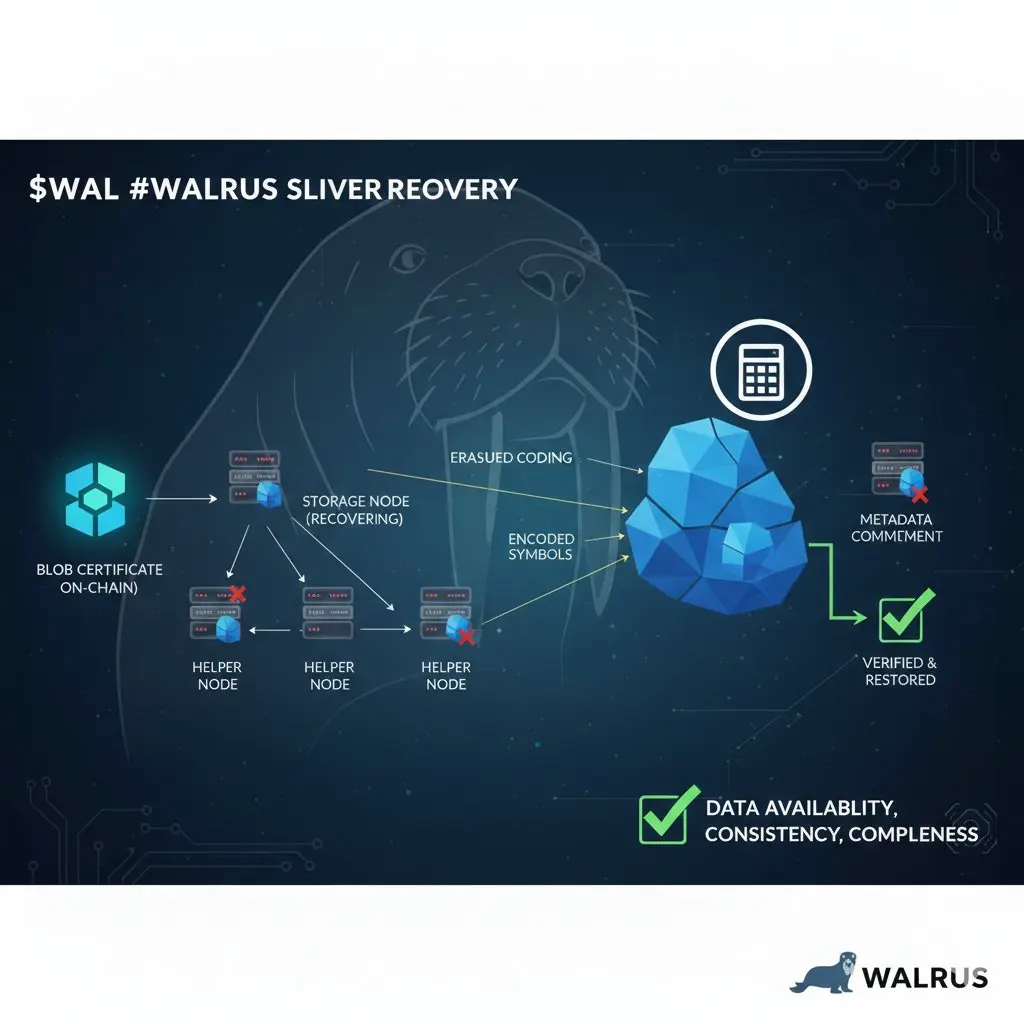
$WAL #walrus In Walrus, a storage node starts recovery when it finds a blob certificate but does not have its assigned slivers. It reconstructs its missing sliver pair via erasure coding and assistance from other nodes, guaranteeing long-term data availability, consistency, and completeness without central coordination. @WalrusProtocol
WAL-2,27%
- Reward
- like
- Comment
- Repost
- Share

- Reward
- like
- Comment
- Repost
- Share
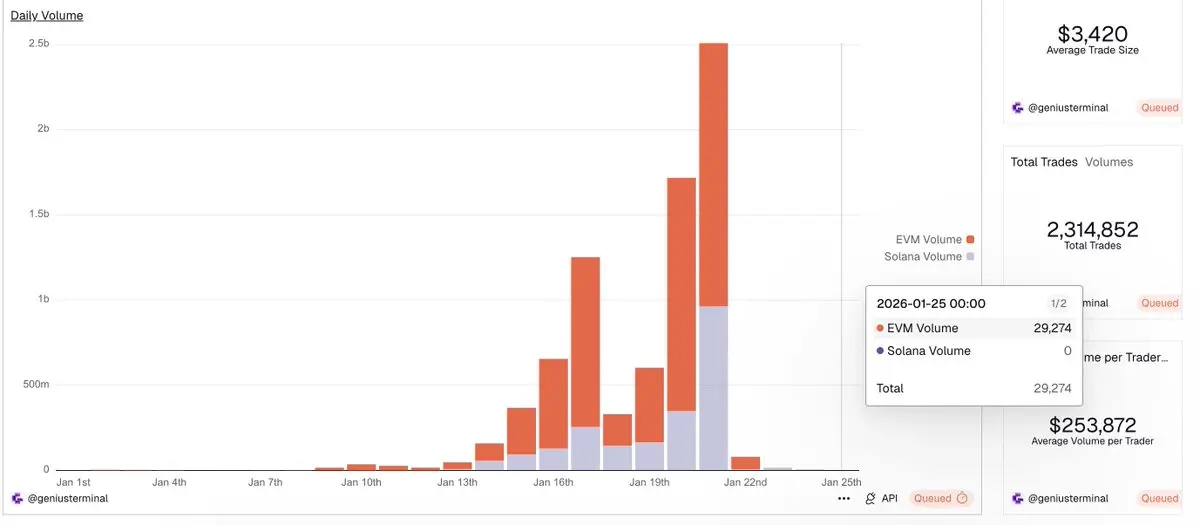
Want to know your Genius score this week? The total trading volume for this week is 4.2 billion, with 10 million points allocated. On average, that’s 420 trading volume per 1 GP. A trading volume of 10,000 is roughly 23.8 points. I checked the data on Dune today—Genius has only 30,000 in trading volume today. You’re not seeing things; it’s just 30,000. The main reasons are as follows: The 10 million points this week are from September 19-26. Previously, there were zero transaction fees, but now there is a 0.3% fee, making costs many times higher. After opening the fee, you shouldn’t be trading
View Original
- Reward
- like
- Comment
- Repost
- Share
sstb
十三太保
Created By@AdasiOk
Subscription Progress
0.00%
MC:
$0
Create My Token
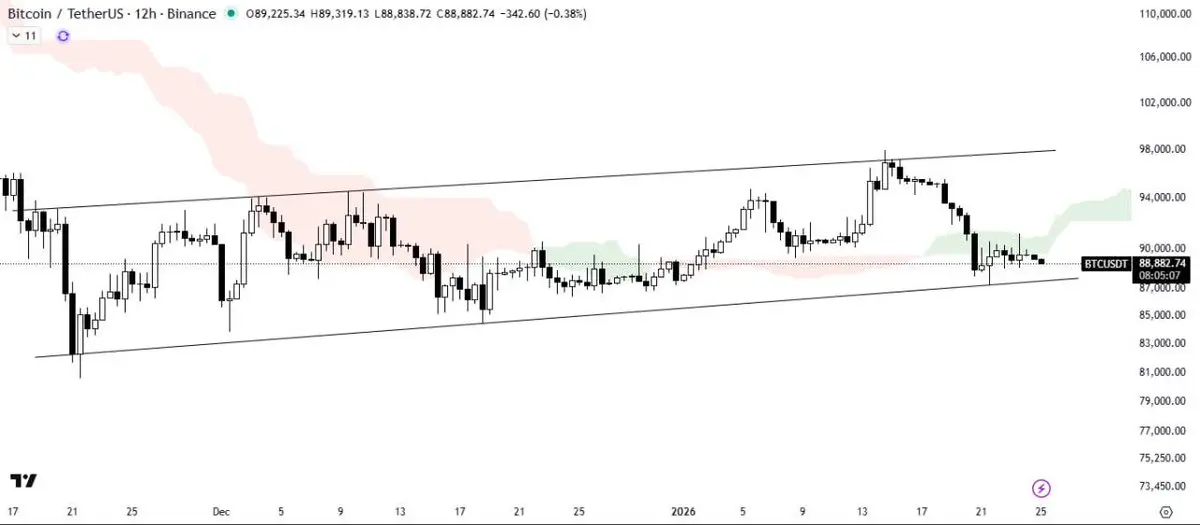
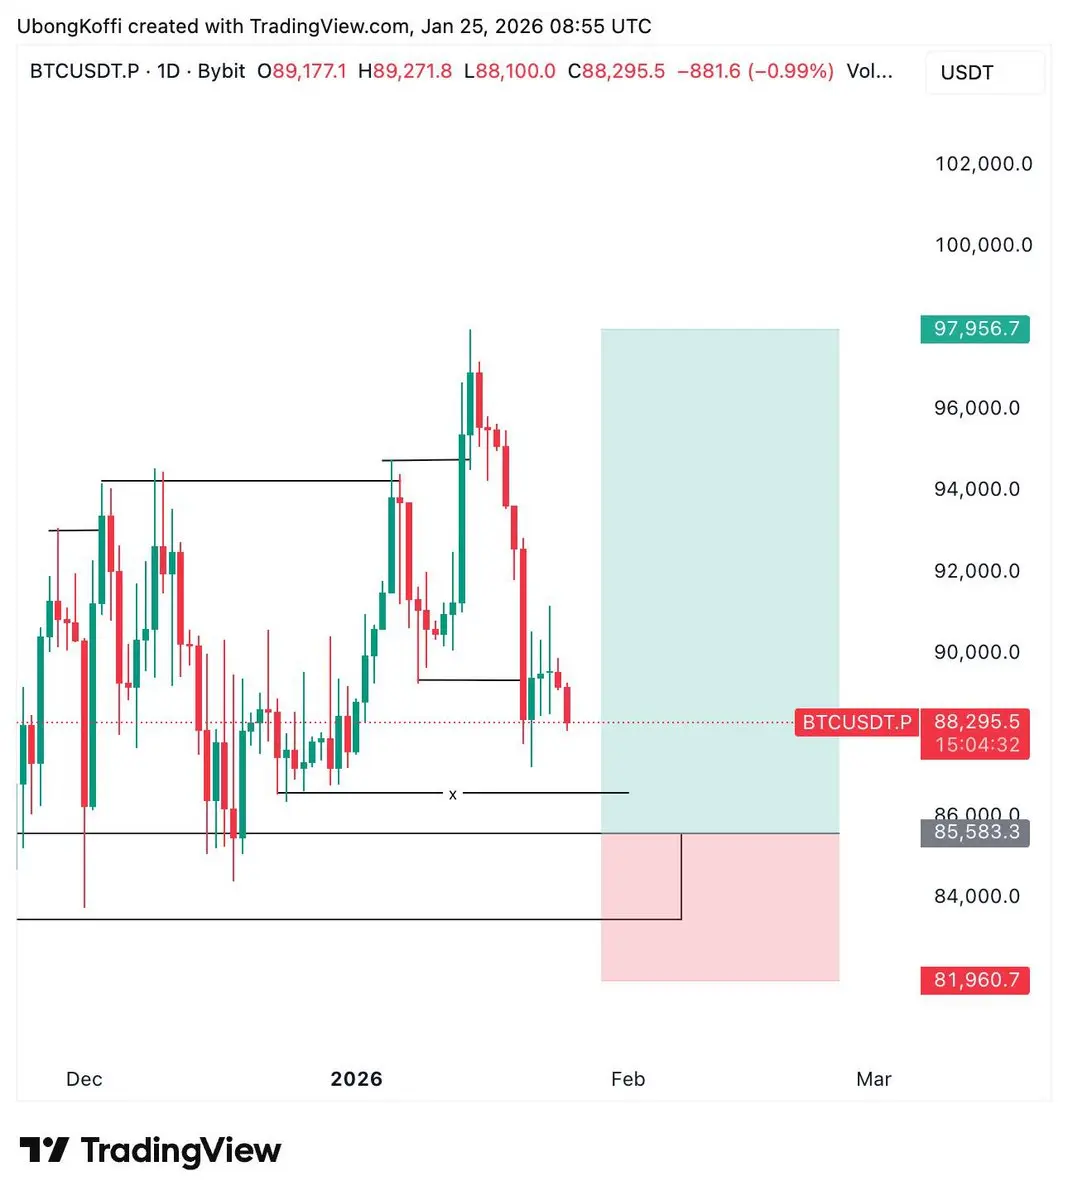
#BTCUSDT ANALYSIS#Bitcoin is consolidating within an ascending channel and is currently facing rejection from the Ichimoku Cloud, which is acting as a resistance barrier. A breakdown below the channel could lead to a downward move, while a rebound from the channel’s support trendline remains possible. #CryptoRecovery $BTC
BTC-1,39%
- Reward
- like
- Comment
- Repost
- Share
Polymarket: Pessimistic predictions on US revenue for 2025 - #cryptocurrency #bitcoin #altcoins
BTC-1,39%

- Reward
- like
- Comment
- Repost
- Share
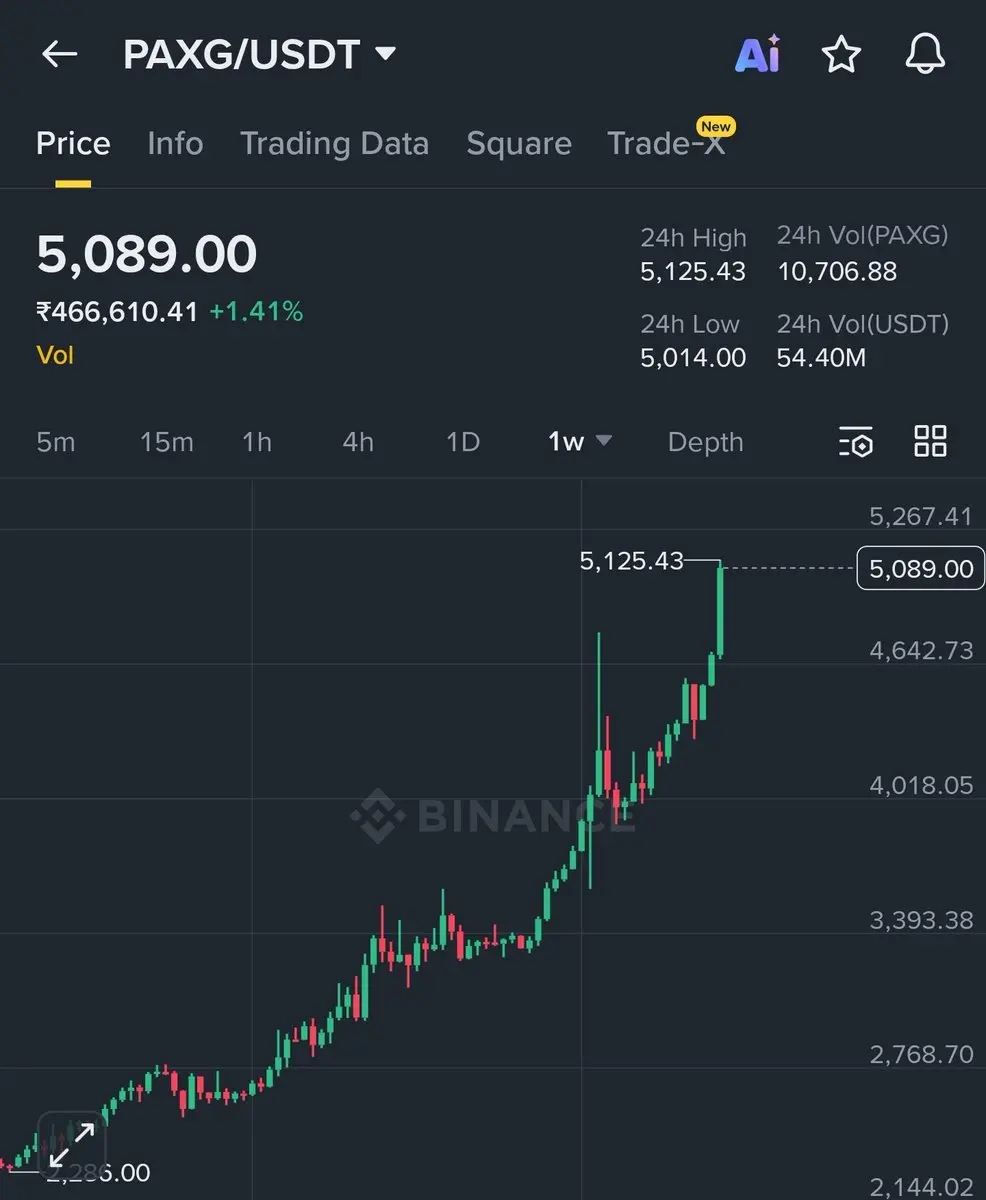
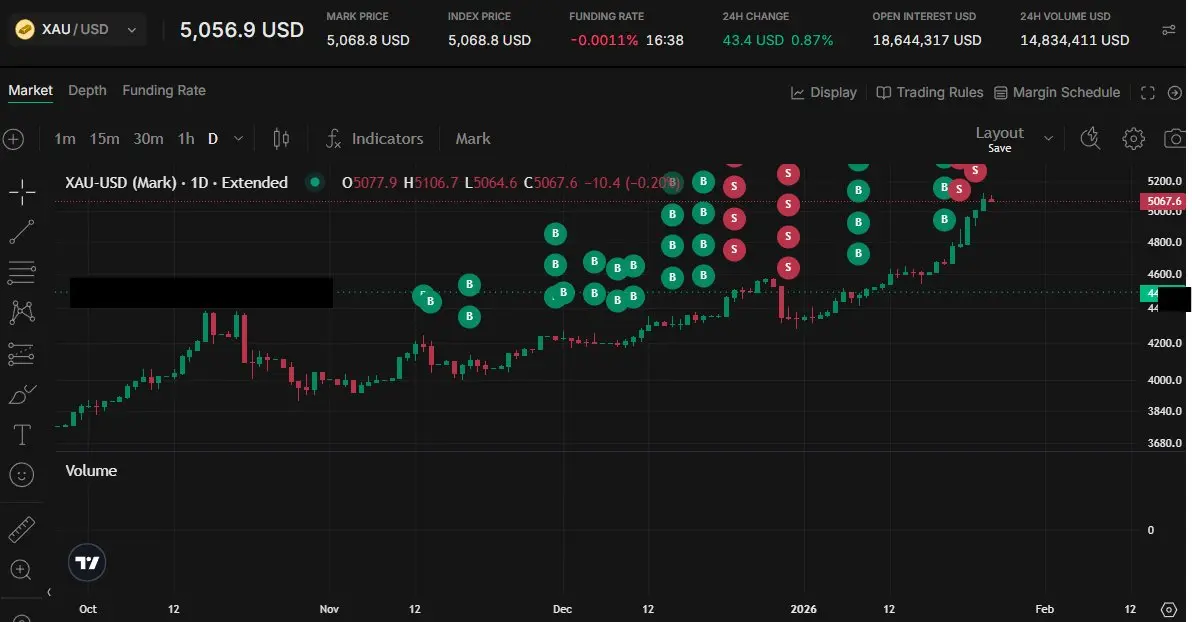
who would\'ve thought that a decent chunk of the net returns this past month has been from being net long metals.
- Reward
- like
- Comment
- Repost
- Share
- Reward
- like
- Comment
- Repost
- Share
- Reward
- like
- Comment
- Repost
- Share
Load More
Join 40M users in our growing community
⚡️ Join 40M users in the crypto craze discussion
💬 Engage with your favorite top creators
👍 See what interests you
Trending Topics
View More64.85K Popularity
39.32K Popularity
32.48K Popularity
14.58K Popularity
26.32K Popularity
Hot Gate Fun
View More- MC:$0.1Holders:10.00%
- MC:$3.39KHolders:10.00%
- MC:$3.4KHolders:10.00%
- MC:$3.4KHolders:10.00%
- MC:$3.4KHolders:10.00%
News
View MoreHong Kong police investigate a virtual currency scam involving HKD 21.4 million, no arrests made yet.
9 m
Opinion: It is unrealistic for Chinese victims of the Qian Zhimin case to expect BTC prices to soar and receive "satisfactory" high compensation
12 m
Data: Internal Bitcoin exchange traffic drops to approximately 14,000 coins, the lowest level since 2022
1 h
Qian Zhimin's Bitcoin recovery case holds a procedural hearing in the UK, with the judge focusing on the issue of "proxy proliferation" involving Chinese victims.
1 h
Scroll co-founder’s X account has been compromised. Do not interact with any links or private messages.
1 h
Pin