Date: Fri, Dec 19 2025 | 12:45 PM GMT
The broader cryptocurrency market is showing relative strength despite concerns around the Japan rate hike. Cooling U.S. inflation has helped both Bitcoin (BTC) and Ethereum (ETH) hold in the green, and this stability is beginning to spill over into select altcoins, including Stellar (XLM).
XLM has posted modest gains today, but beyond the short-term price move, the daily chart is starting to reveal an emerging technical structure that could set the stage for a more meaningful recovery if key levels continue to hold.
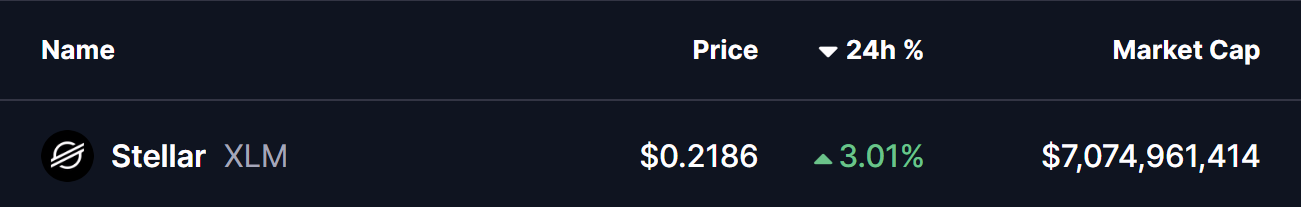
Source: Coinmarketcap
Harmonic Pattern Signals Potential Upside
On the daily timeframe, XLM appears to be forming a Bearish Cypher harmonic pattern — a setup that often generates upside momentum during its final CD leg before price reaches the Potential Reversal Zone (PRZ).
The pattern began at point X near the $0.3113 region, where XLM topped out before entering a sharp corrective phase. Price then declined into point A, followed by a rebound toward point B. From there, XLM rolled over again and extended lower into point C around the $0.2029 area, completing the core structure of the pattern.
Since tagging this low, XLM has started to stabilize and grind higher, currently trading near the $0.2188 level. This slow but steady recovery suggests that selling pressure may be fading, with buyers beginning to defend the recent lows more aggressively.
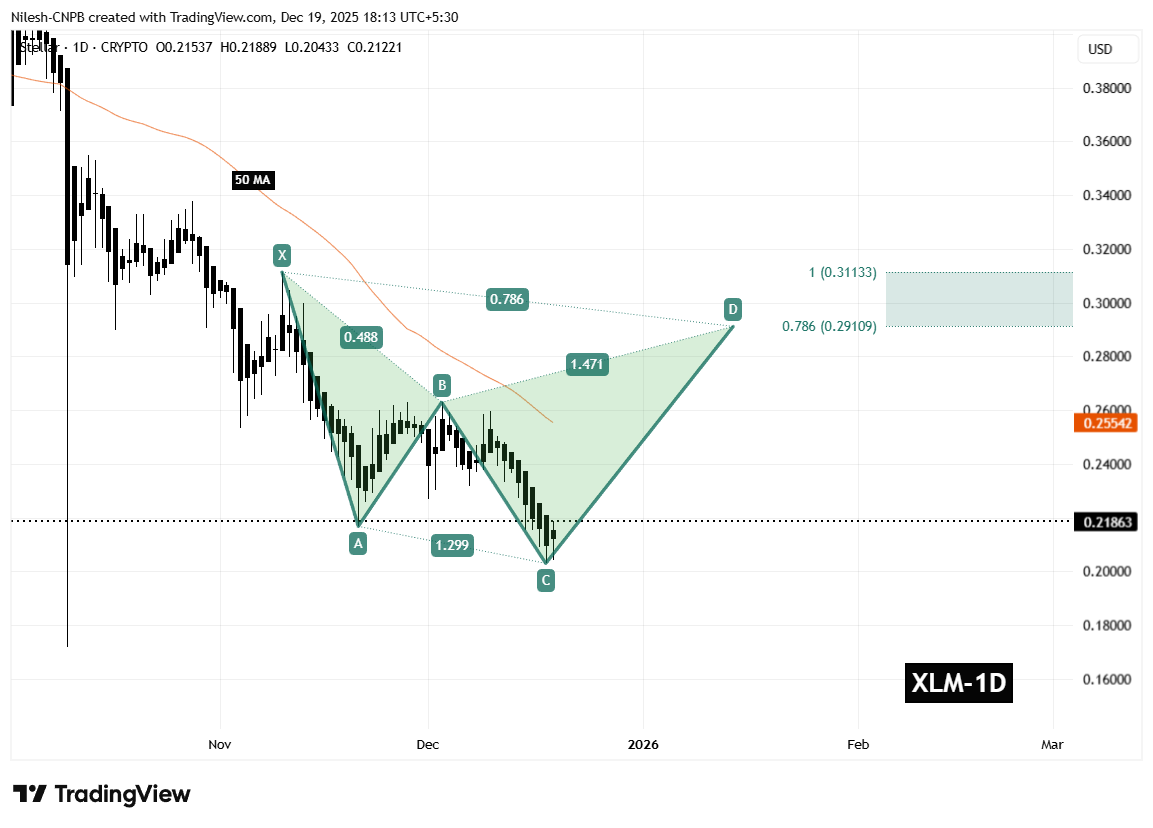
Stellar (XLM) Daily Chart /Coinsprobe (Source: Tradingview)
A key technical factor aligning with this structure is the 50-day moving average, currently positioned near $0.2554. This moving average has consistently acted as dynamic resistance throughout the downtrend and represents an important hurdle for bulls to overcome in the near term.
What’s Next for XLM?
In the short term, the most critical level to monitor is the C-leg support around $0.2029. As long as XLM holds above this zone, the harmonic pattern remains valid and the bullish CD-leg scenario stays intact.
If price continues to build strength from this base, the next major test will be a reclaim of the 50-day moving average near $0.2554. A decisive break and close above this level would signal improving momentum and could accelerate upside continuation.
Based on the harmonic structure, the projected upside targets sit within the Potential Reversal Zone, defined between the 0.786 Fibonacci extension near $0.2910 and the 1.0 extension around $0.3113. Reaching this zone would represent a potential upside of roughly 40–45% from current price levels, making it a key area where profit-taking or stronger resistance could emerge.
On the downside, failure to hold above the $0.2029 support would significantly weaken the bullish setup. A breakdown below this level could invalidate the harmonic structure and expose XLM to deeper downside pressure before any sustainable recovery attempt develops.
For now, the chart suggests Stellar is sitting at an important technical crossroads. While confirmation is still needed, the presence of a well-defined harmonic pattern indicates that a short- to medium-term bounce remains a realistic possibility if buyers continue to defend current levels and reclaim key resistance zones.
Disclaimer: The views and analysis presented in this article are for informational purposes only and reflect the author’s perspective, not financial advice. Technical patterns and indicators discussed are subject to market volatility and may or may not yield the anticipated results. Investors are advised to exercise caution, conduct independent research, and make decisions aligned with their individual risk tolerance.
Disclaimer: The information on this page may come from third parties and does not represent the views or opinions of Gate. The content displayed on this page is for reference only and does not constitute any financial, investment, or legal advice. Gate does not guarantee the accuracy or completeness of the information and shall not be liable for any losses arising from the use of this information. Virtual asset investments carry high risks and are subject to significant price volatility. You may lose all of your invested principal. Please fully understand the relevant risks and make prudent decisions based on your own financial situation and risk tolerance. For details, please refer to
Disclaimer.
Related Articles
Solana Approaches Key Sell Wall at $84.78 — Will Momentum Hold for a Move Toward $89?
Solana is trading at an approximate price of $83.18, although a solid sell wall is at an approximate price of $84.78, which prevents upward movement.
The price is trapped between the support at $81.99 and the resistance at $84.78 which is short term consolidation.
Once buyers hit the
CryptoNewsLand9m ago
SOL Consolidates Near $84 While Chart Highlights Possible $45 Demand Zone
Solana (SOL) trades at $83.87 within a range defined by $81.03 support and $84.43 resistance, showing consolidation below a $90 supply zone. There is a broader demand area near $45, indicating potential downward movement before recovery.
CryptoNewsLand13m ago
Santiment: The surge in active USDT addresses on a certain public blockchain is correlated with the rebound of BTC
Research firm Santiment found that over the past year, when USDT active addresses on a certain public blockchain surged three times, BTC price rebounded each time, indicating that USDT liquidity has a significant impact on BTC price.
GateNews1h ago
PEPE Consolidates Above $0.05324 Support as Momentum Strengthens and Resistance Near $0.05336 Holds
PEPE has a tight intraday price compression with a support level of $0.053243 and resistance level of $0.053363.
A RSI of 64.13 represents the moderate bullish momentum whereas MACD history is slightly positive, which indicates the gradual buying momentum.
The price is at $0.053364
CryptoNewsLand1h ago
Michael Saylor: Strategy - There is a time lag between buying Bitcoin and price appreciation
Gate News reports that on March 12, Strategy founder Michael Saylor posted: "There is a time lag between when we purchase Bitcoin and when the Bitcoin price skyrockets."
GateNews2h ago
Why OXT Just Skyrocketed 21.97% in 30 Minutes
OXT price surged 21.97%, now at $0.0211, driven by macroeconomic trends and increased trading activity. Analysts suggest the bullish sentiment in major cryptocurrencies boosts altcoin interest, while traders watch key resistance and support levels.
Coinfomania2h ago