$SOL Here is a complete and in-depth technical analysis of the K-line (candlestick) chart.
#GateSquareAIReviewer 1. Current Market Snapshot
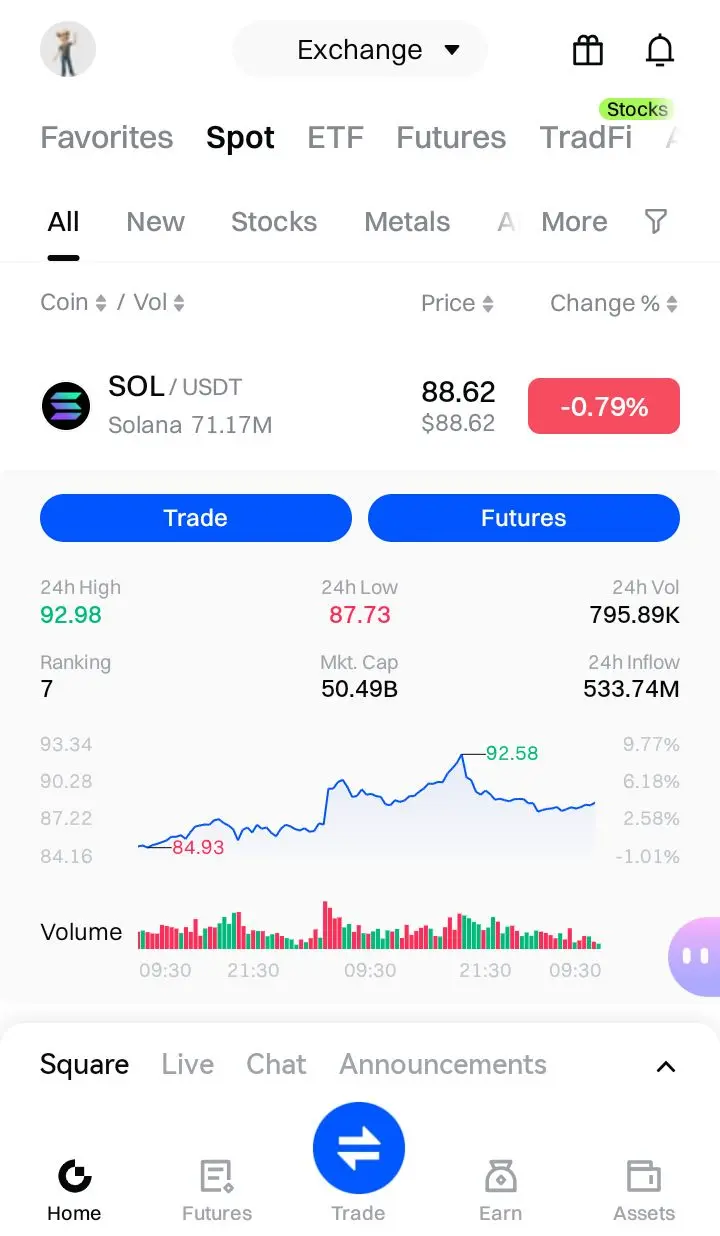
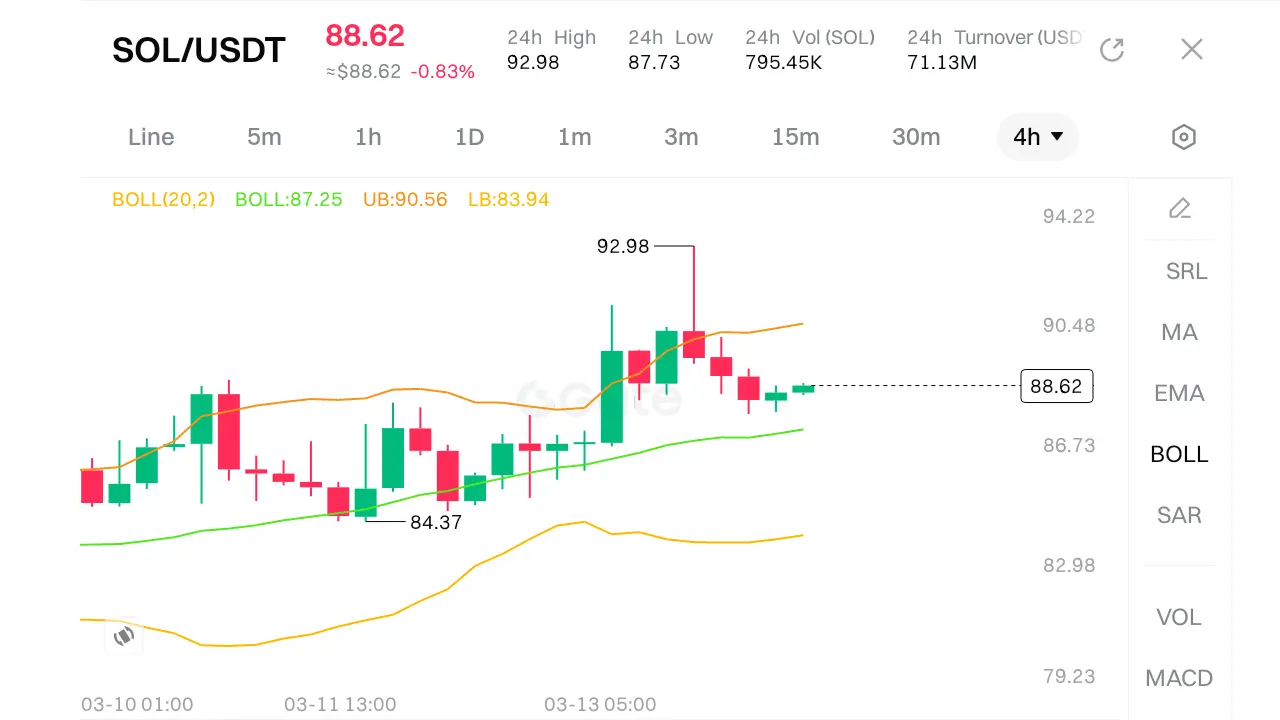
· Current Price: $88.62
· 24h Change: -0.83%
· Range: The price is trading between the 24h High ($92.98) and 24h Low ($87.73), indicating a relatively contained trading session with a slight bearish bias.
2. Indicator Analysis: Bollinger Bands (BOLL)
The chart is currently using the Bollinger Bands (20,2) . This is a volatility indicator consisting of a middle band (SMA 20), an upper band, and a lower band.
· Current Bands:
· Upper Band (UB): $90.56