$BTC 3.4 Midday Bitcoin and Ethereum Market Analysis and Trading Suggestions
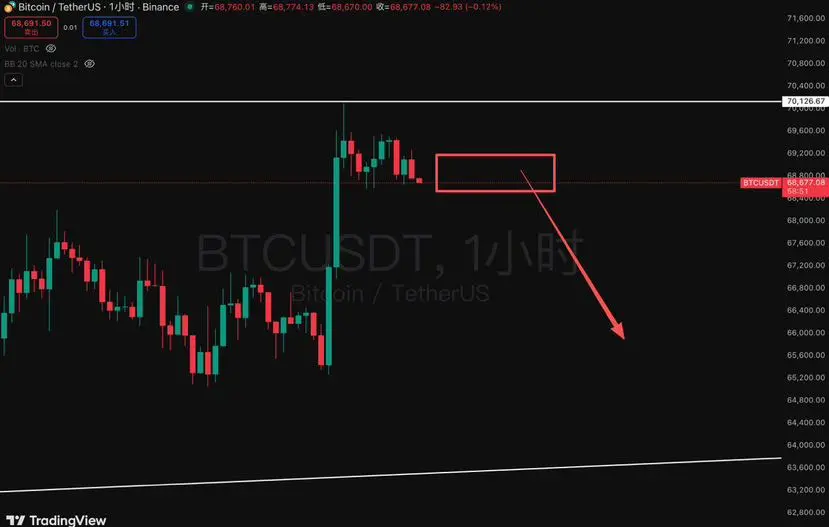
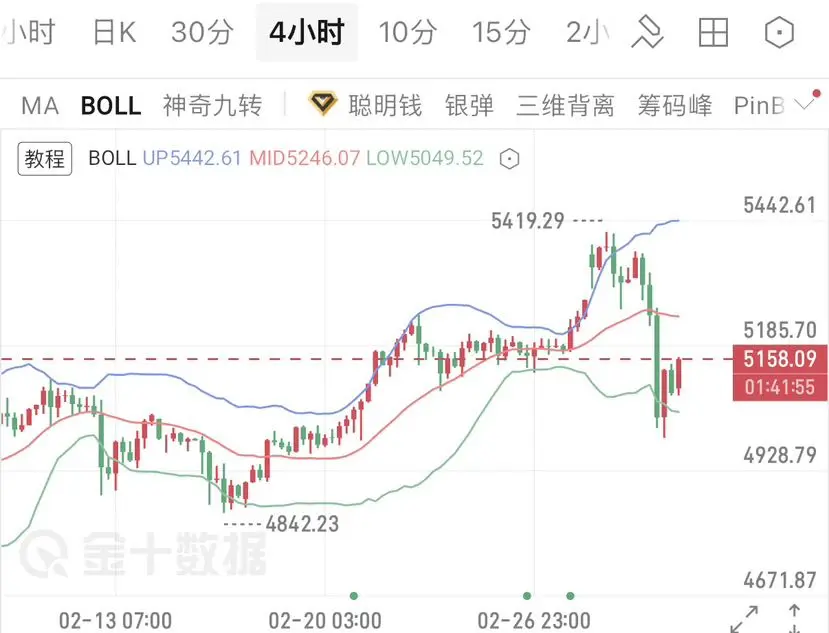
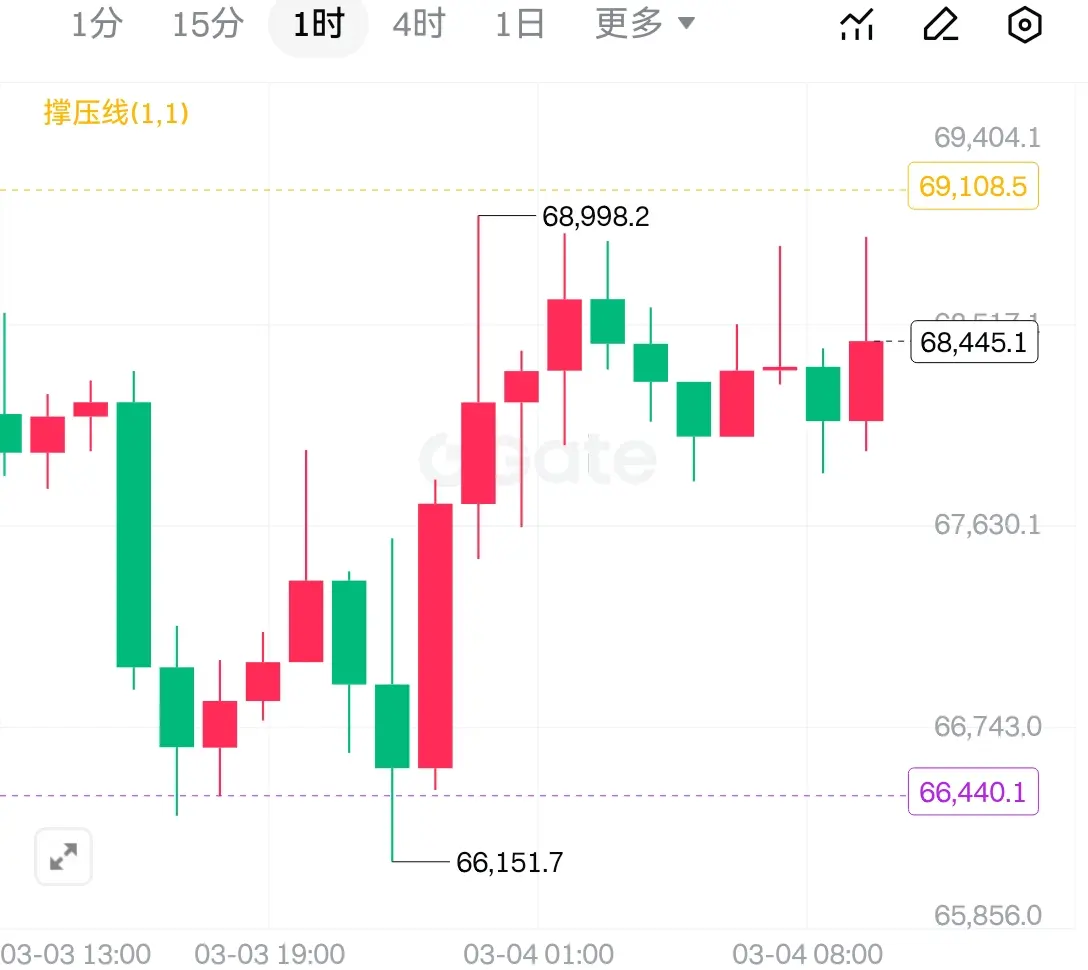
Currently, the 4-hour chart shows that the market is in a "liquidity trap" phase: the price fluctuation range continues to narrow, forming a typical descending triangle consolidation. This structure is often seen as a bearish continuation pattern, indicating a higher probability of the downtrend resuming after the consolidation ends.
From a volume perspective, recent bullish moves have seen short-term volume spikes, but the volume-price relationship shows divergence. This rebound volume is a typical "weak rebound," on