


#95%ofAltsBelow200-daySMA
If you’ve been keeping a close eye on the markets lately, you've likely noticed that recurring hashtag: #95%ofAltsBelow200-daySMA. It’s far more than just a statistic; it is the mathematical manifestation of the "survival struggle" currently gripping the altcoin world.
Let’s dive into this from a professional perspective—grab a coffee, and let's break down what’s really happening under the hood.
The 200-Day SMA: Why Is It the Line in the Sand?
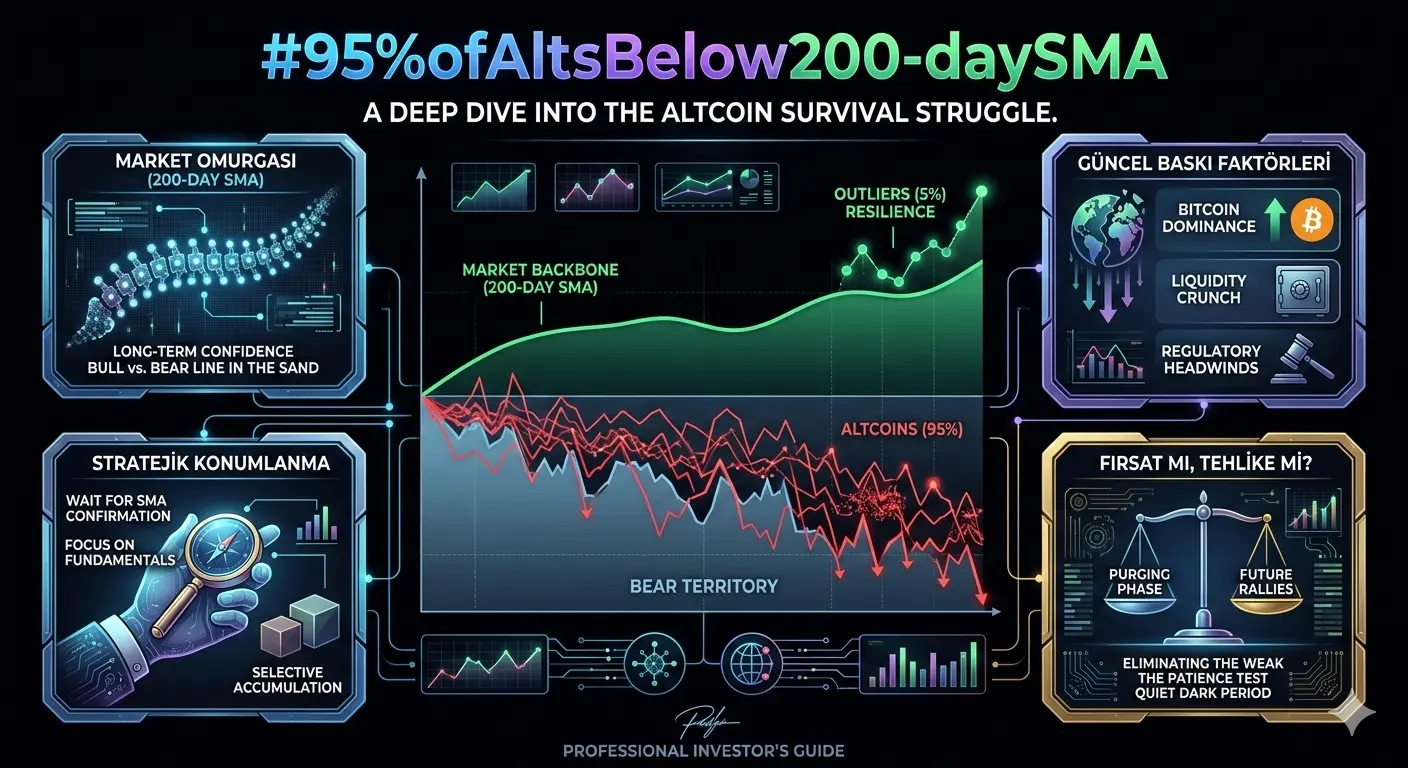
In the world of technical analysis, the 200-day Simple Moving Average (SMA) acts as the market's "backbone." When prices hold above this line, the outlook is sunny and investor appetite is high. However, once the price slips below it, that asset is officially drifting through "bear territory."
The fact that a staggering 95% of all altcoins are currently trading below this level tells a heavy story. it indicates a widespread loss of long-term confidence and shows that institutional interest has retreated to the sidelines. The charts are whispering a clear message: "It’s far too early to talk about a general bull rally just yet."
Current News and the Forces Pressuring the Market
Looking at the current macroeconomic climate, it’s not hard to see why this 95% threshold remains so stubborn. Several key factors are keeping the lid on:
Bitcoin Dominance: Capital is fleeing the high-risk altcoin sector, seeking refuge in the relative safety of Bitcoin. This flight to quality prevents altcoins from gaining the technical momentum needed to break out.
Liquidity Crunch: Global monetary tightening and a lack of "cheap money" have stifled speculative movements. Without a fresh influx of liquidity, altcoins simply lack the fuel to ignite.
Regulatory Headwinds: Constant news regarding exchange crackdowns and project audits has forced investors into a "wait-and-see" stance. Even projects making significant technological leaps are struggling to find the volume necessary to reclaim their 200-day averages.
Opportunity or Trap?
From a professional standpoint, I view these levels as the market’s ultimate "purging" phase.
Eliminating the Weak: This is where hollow projects without real utility or community backing fade away. Meanwhile, fundamentally sound projects enter what we call the "accumulation phase."
The Patience Test: Historically, when the vast majority of altcoins are submerged below this average, market despair is at its peak. But remember: the most legendary rallies often begin at the end of these silent, dark periods.
Strategic Positioning: Right now, the most logical move is to wait for price confirmation above the 200-day SMA or to closely track the rare few projects showing strength near this level backed by strong news catalysts.
Ultimately, the market is telling us: "Don't rush; let me prove myself first." As long as this massive 95% majority stays below the average, the golden rule for any professional investor is to remain selective and focus only on the outliers showing true resilience.
If you’ve been keeping a close eye on the markets lately, you've likely noticed that recurring hashtag: #95%ofAltsBelow200-daySMA. It’s far more than just a statistic; it is the mathematical manifestation of the "survival struggle" currently gripping the altcoin world.
Let’s dive into this from a professional perspective—grab a coffee, and let's break down what’s really happening under the hood.
The 200-Day SMA: Why Is It the Line in the Sand?
In the world of technical analysis, the 200-day Simple Moving Average (SMA) acts as the market's "backbone." When prices hold above this line, the outlook is sunny and investor appetite is high. However, once the price slips below it, that asset is officially drifting through "bear territory."
The fact that a staggering 95% of all altcoins are currently trading below this level tells a heavy story. it indicates a widespread loss of long-term confidence and shows that institutional interest has retreated to the sidelines. The charts are whispering a clear message: "It’s far too early to talk about a general bull rally just yet."
Current News and the Forces Pressuring the Market
Looking at the current macroeconomic climate, it’s not hard to see why this 95% threshold remains so stubborn. Several key factors are keeping the lid on:
Bitcoin Dominance: Capital is fleeing the high-risk altcoin sector, seeking refuge in the relative safety of Bitcoin. This flight to quality prevents altcoins from gaining the technical momentum needed to break out.
Liquidity Crunch: Global monetary tightening and a lack of "cheap money" have stifled speculative movements. Without a fresh influx of liquidity, altcoins simply lack the fuel to ignite.
Regulatory Headwinds: Constant news regarding exchange crackdowns and project audits has forced investors into a "wait-and-see" stance. Even projects making significant technological leaps are struggling to find the volume necessary to reclaim their 200-day averages.
Opportunity or Trap?
From a professional standpoint, I view these levels as the market’s ultimate "purging" phase.
Eliminating the Weak: This is where hollow projects without real utility or community backing fade away. Meanwhile, fundamentally sound projects enter what we call the "accumulation phase."
The Patience Test: Historically, when the vast majority of altcoins are submerged below this average, market despair is at its peak. But remember: the most legendary rallies often begin at the end of these silent, dark periods.
Strategic Positioning: Right now, the most logical move is to wait for price confirmation above the 200-day SMA or to closely track the rare few projects showing strength near this level backed by strong news catalysts.
Ultimately, the market is telling us: "Don't rush; let me prove myself first." As long as this massive 95% majority stays below the average, the golden rule for any professional investor is to remain selective and focus only on the outliers showing true resilience.