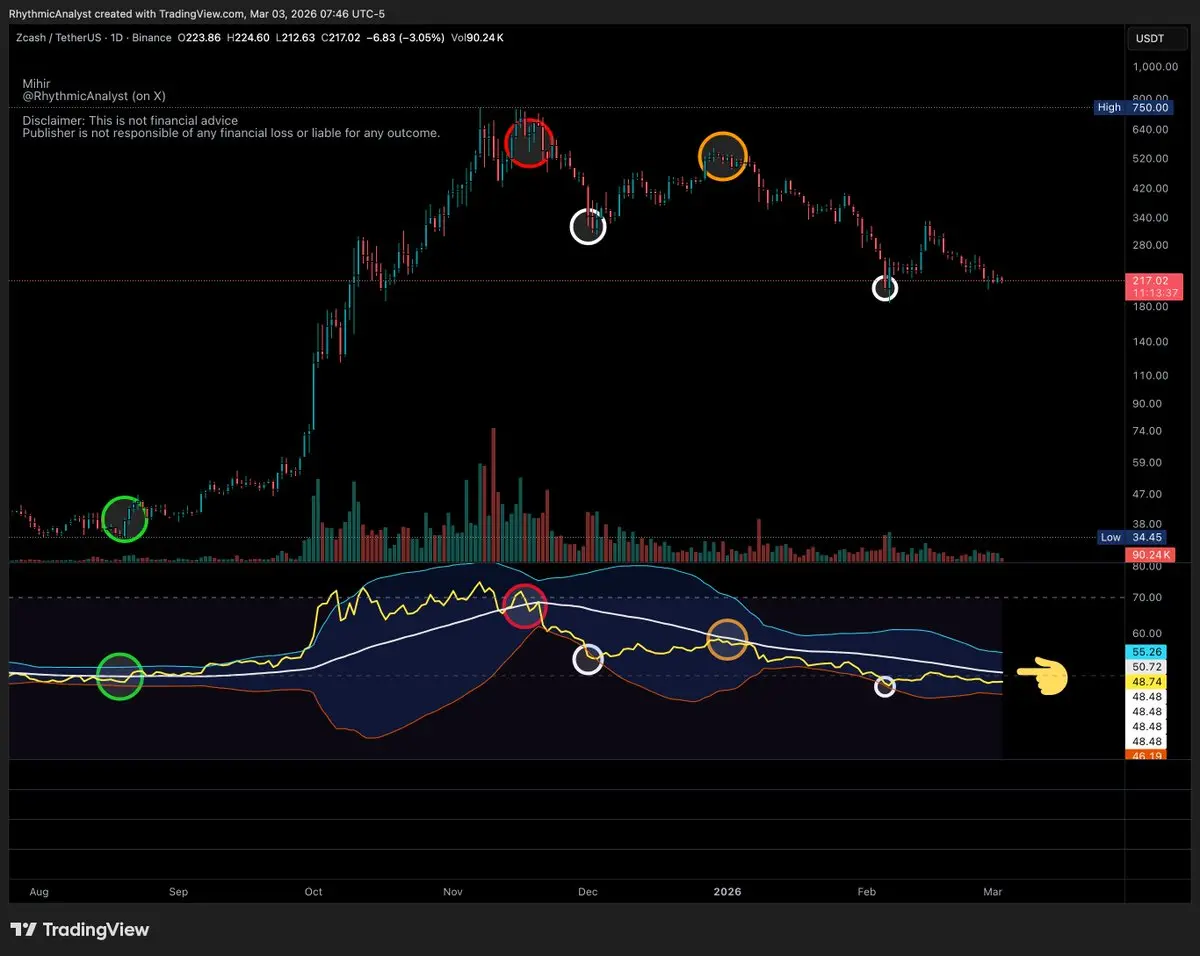
Let’s understand ZEC’s price action using an oscillator.
No detailed explanation is required—the markers tell the whole story. So, let’s begin…
Green circle – the start of an uptrend near $40 in August 2025.
Red circle – the top near $625 in mid-November 2025.
Orange circle – a major recovery attempt that hit the oscillator’s average line.
White circles – piercings of the lower bound of the oscillator, indicating recovery attempts or support.
The next projected level is the average line, provided the February low holds.
#ZEC #ZCash
$ZEC #Crypto #ZECUSDT