


#GateSquareAprilPostingChallenge Bitcoin Overview
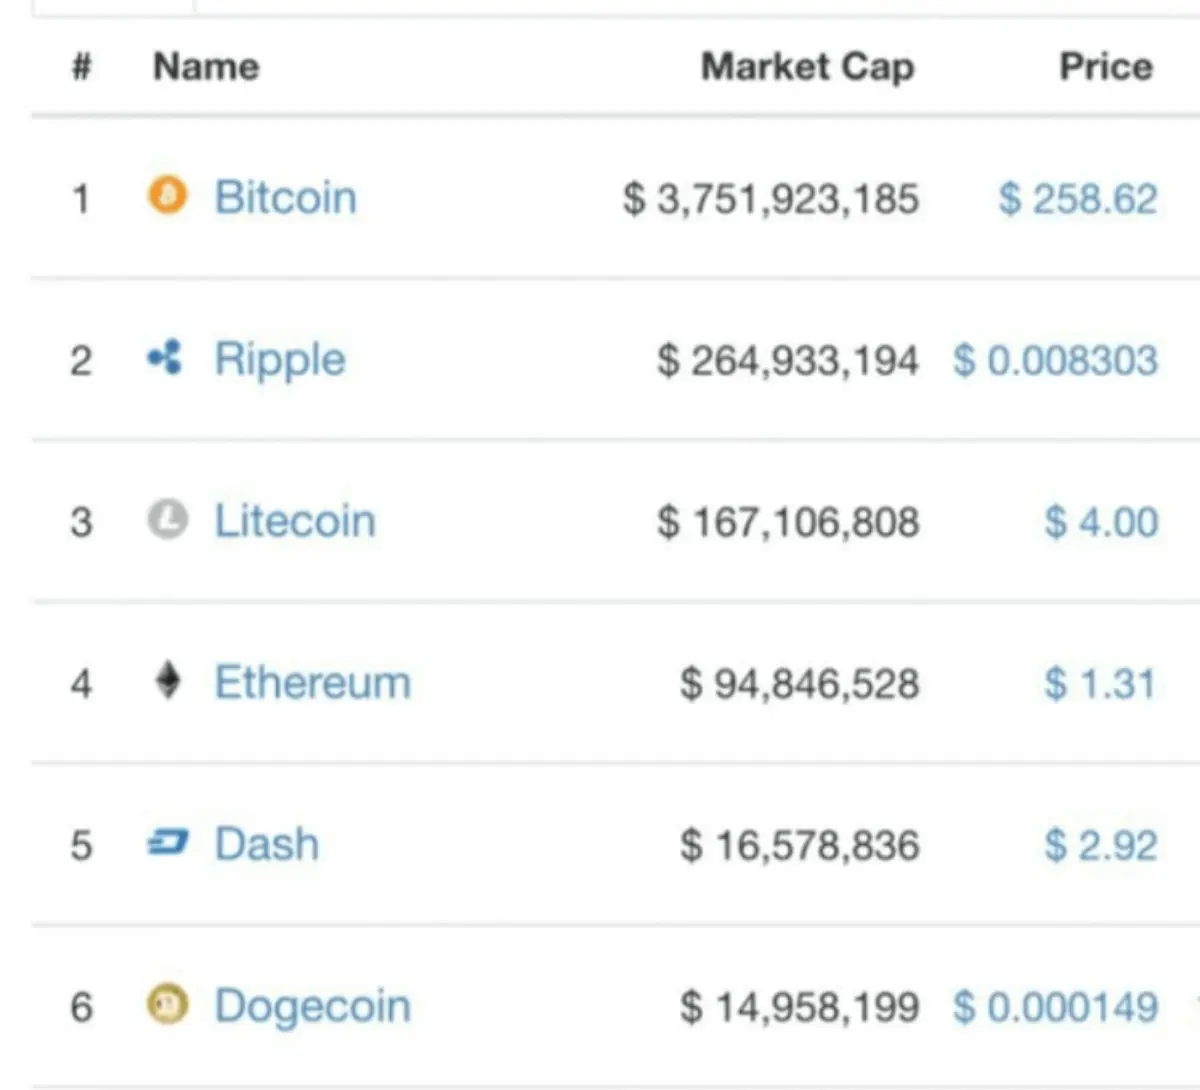
Bitcoin is the first decentralized cryptocurrency, launched in 2009 by Satoshi Nakamoto. Its fixed supply of 21 million coins makes it scarce, often likened to digital gold. As of April 5, 2026, Bitcoin remains the top cryptocurrency in the market.
Current Market Data
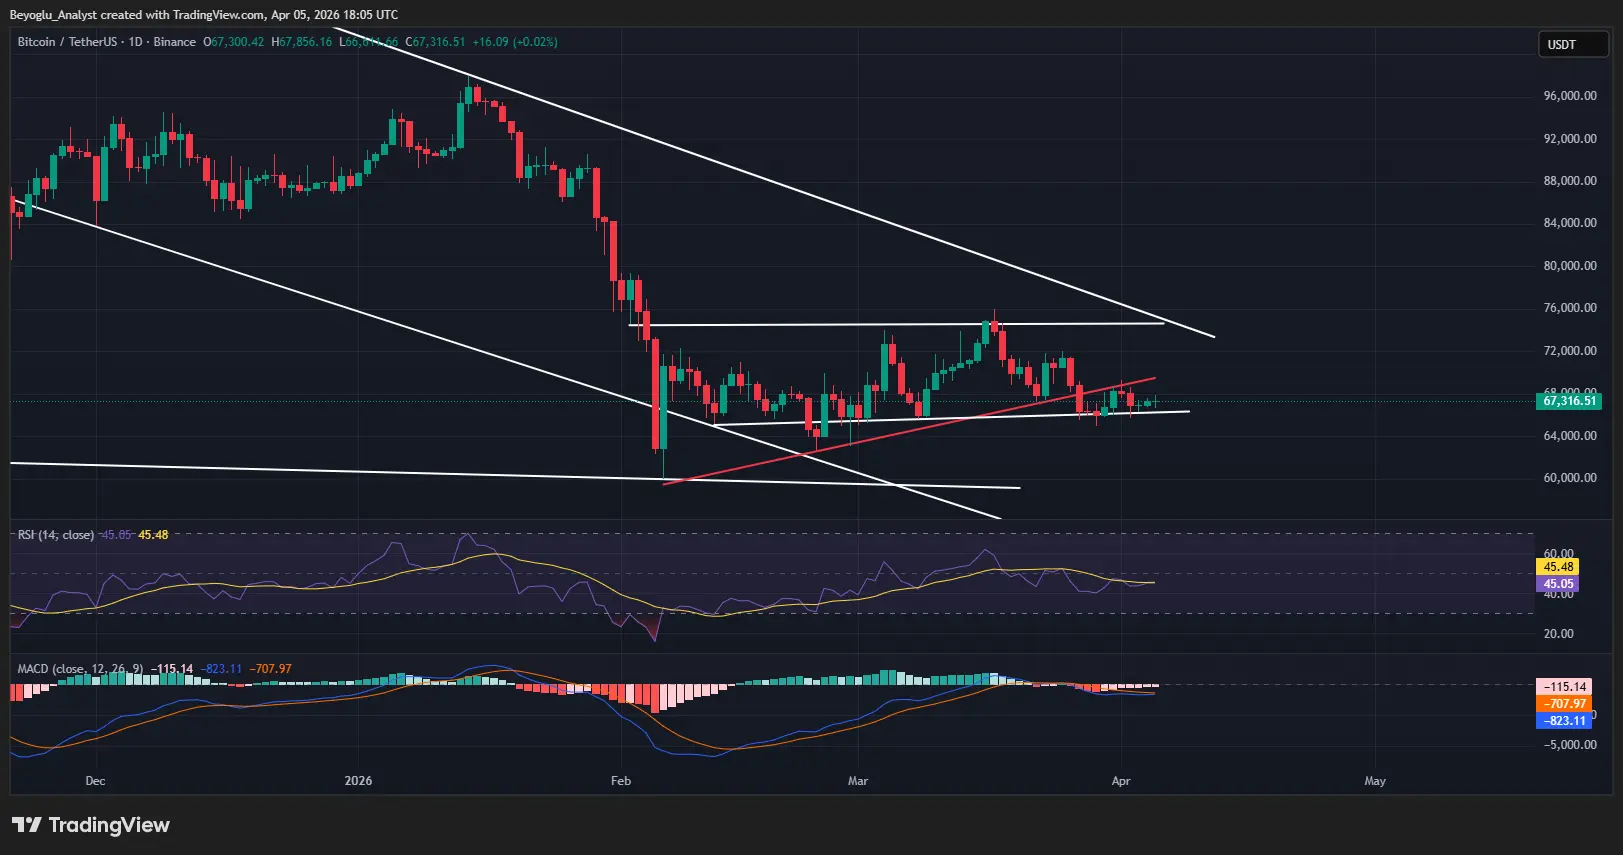
$BTC is trading around $67,339, with a 24-hour high of $67,856 and a low of $66,611. The price has shown moderate volatility within this range, reflecting ongoing market uncertainty.
Market Conditions
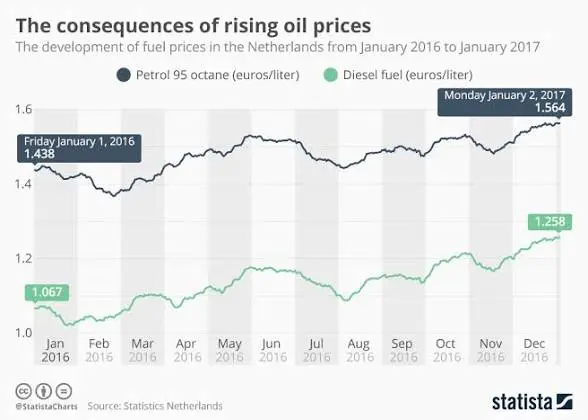
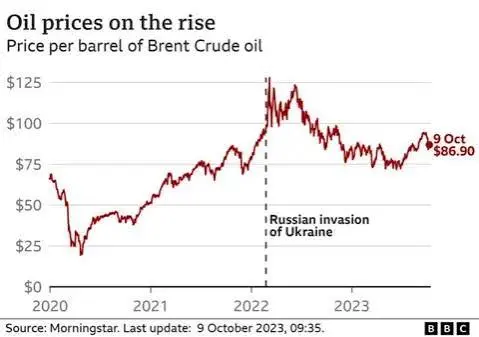
Global macroeconomic factors, especially the Iran war, have pushed oil prices higher, increasing inflation concerns and affecting financial markets. This has added pressure to the crypto market, making a rebound more challenging.
If you need more details about Bitcoin or other cryptocurrencies, feel free to ask!
Bitcoin is the first decentralized cryptocurrency, launched in 2009 by Satoshi Nakamoto. Its fixed supply of 21 million coins makes it scarce, often likened to digital gold. As of April 5, 2026, Bitcoin remains the top cryptocurrency in the market.
Current Market Data
$BTC is trading around $67,339, with a 24-hour high of $67,856 and a low of $66,611. The price has shown moderate volatility within this range, reflecting ongoing market uncertainty.
Market Conditions
Global macroeconomic factors, especially the Iran war, have pushed oil prices higher, increasing inflation concerns and affecting financial markets. This has added pressure to the crypto market, making a rebound more challenging.
If you need more details about Bitcoin or other cryptocurrencies, feel free to ask!