Is Fluid (FLUID) a good investment?: A Comprehensive Analysis of Market Potential, Technology, and Risk Factors


Introduction: Fluid (FLUID) Investment Position and Market Prospects
Fluid is an important asset in the crypto currency field. As a lending protocol under the multi-chain DeFi management platform Instadapp, it has gained notable traction in the decentralized finance sector. As of December 2025, FLUID has a fully diluted valuation of $283.5 million with a circulating supply of approximately 39.44 million tokens. The current price stands at $2.835 per token. With its positioning as a key lending protocol in the DeFi ecosystem, FLUID has gradually become a focal point when investors consider "Is Fluid (FLUID) a good investment?" This article will provide a comprehensive analysis of FLUID's investment value, historical price trends, future price predictions, and investment risks to serve as a reference for investors.
Fluid (FLUID) Cryptocurrency Research Report
I. FLUID Price History Review and Current Investment Status
FLUID Historical Price Trends and Investment Performance
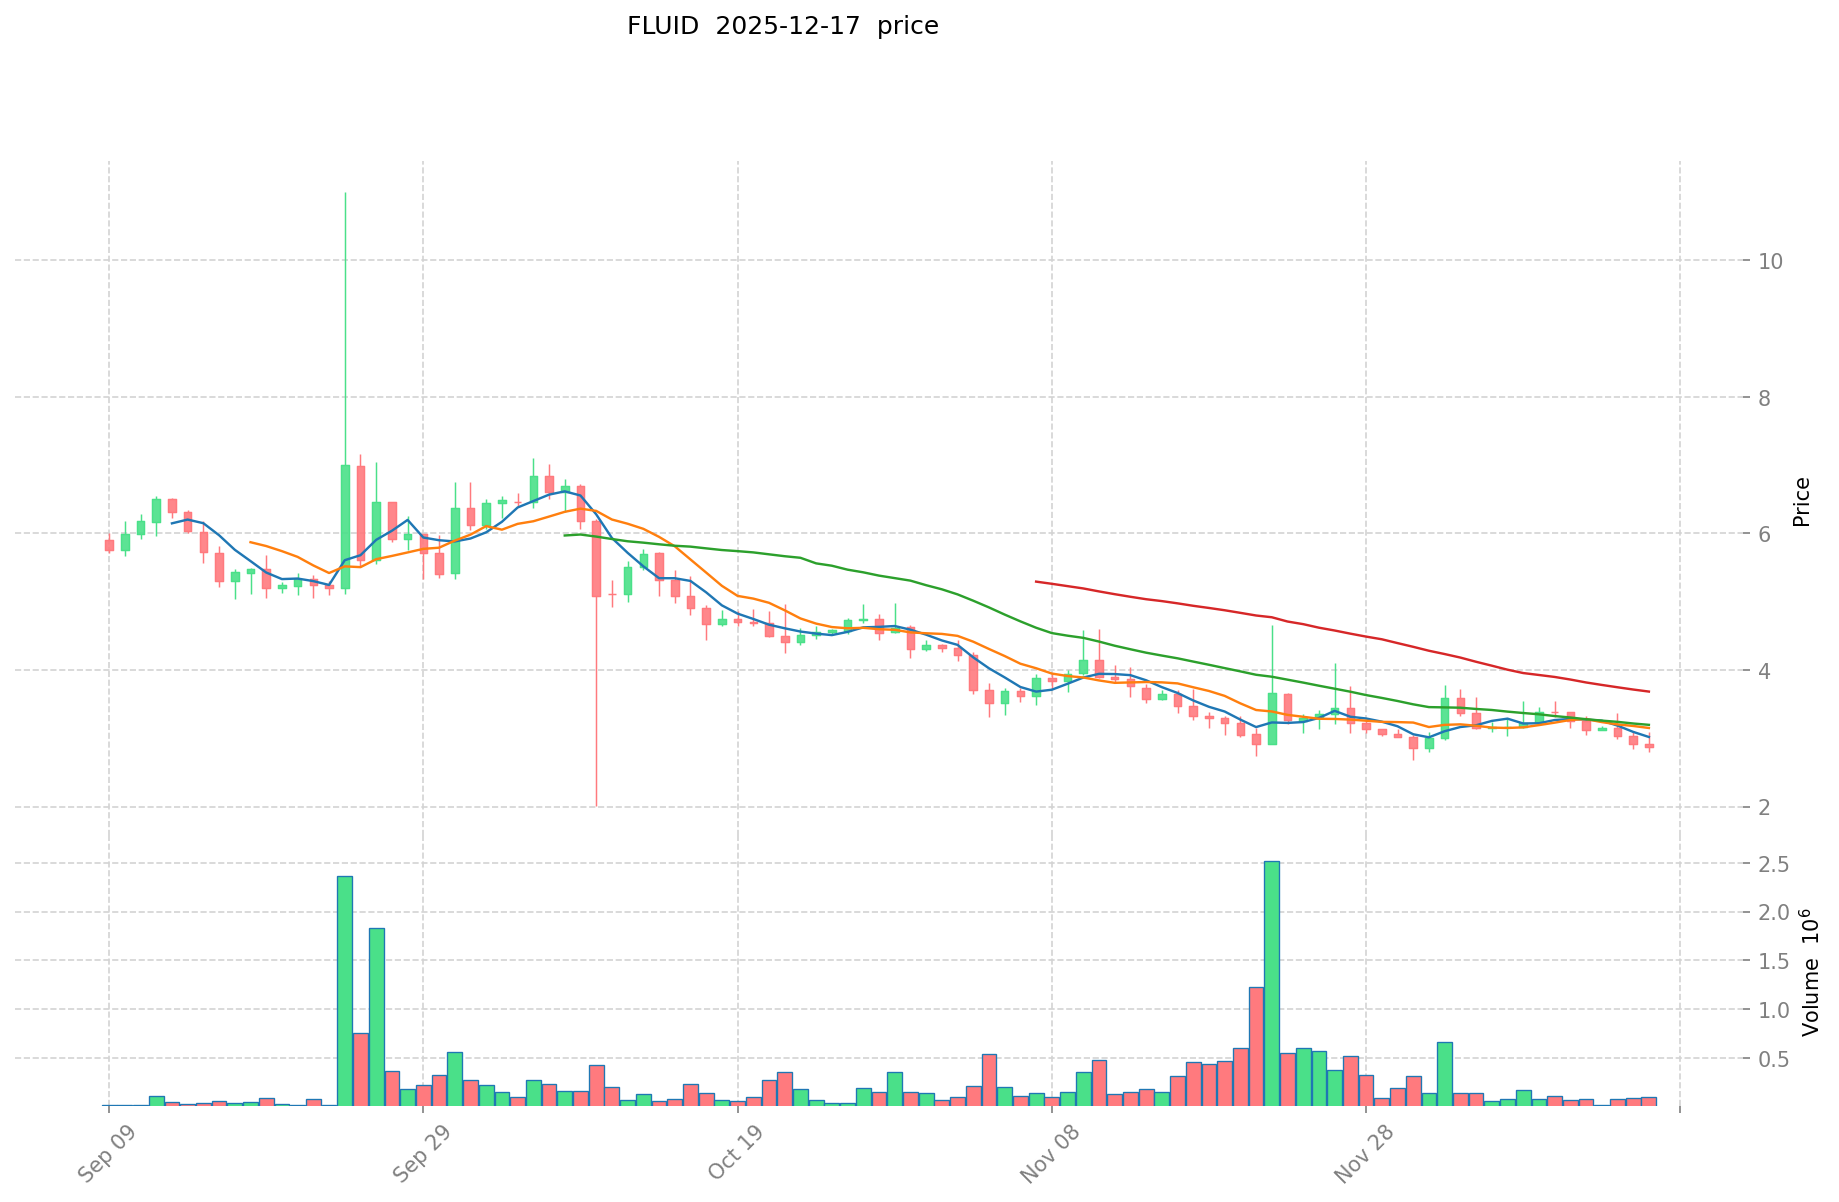
Based on available market data as of December 17, 2025:
- All-Time High (ATH): $11.00 (reached on September 24, 2025)
- All-Time Low (ATL): $2.017 (reached on October 10, 2025)
- Current Price Movement: From ATH to ATL represents a significant downward correction of approximately 81.7% within a 16-day period
Price Performance Across Multiple Timeframes
| Timeframe | Price Change | Amount Change |
|---|---|---|
| 1 Hour | -0.35% | -$0.009957 |
| 24 Hours | +0.21% | +$0.005941 |
| 7 Days | -15.03% | -$0.501472 |
| 30 Days | -21.09% | -$0.757701 |
| 1 Year | -70.25% | -$6.694412 |
Current FLUID Investment Market Status (December 17, 2025)
- Current Price: $2.835 USD
- 24-Hour Trading Range: High $2.919 / Low $2.827
- 24-Hour Trading Volume: $201,080.65 USD
- Market Capitalization: $111,803,336.51 USD
- Fully Diluted Valuation (FDV): $283,500,000.00 USD
- Market Dominance: 0.0090%
- Circulating Supply: 39,436,803 FLUID (39.44% of total supply)
- Total Supply: 100,000,000 FLUID (fixed maximum supply)
- Number of Holders: 10,985
- Listed on Exchanges: 23 trading venues
Current real-time FLUID market price available at: https://www.gate.com/price/fluid-fluid
II. Project Overview
Fluid is a lending protocol operating under Instadapp, a multi-chain DeFi (Decentralized Finance) management platform. The token is implemented as an ERC20 standard contract on the Ethereum blockchain.
Contract Address (Ethereum): 0x6f40d4a6237c257fff2db00fa0510deeecd303eb
Official Resources:
- Website: https://fluid.io/
- Twitter: https://x.com/0xfluid
- Etherscan: https://etherscan.io/token/0x6f40d4a6237c257fff2db00fa0510deeecd303eb
III. Market Position Analysis
- CoinGecko Ranking: #321
- Market Cap to FDV Ratio: 39.44% (indicating significant difference between current and fully diluted valuations)
- Price Performance Assessment: The token exhibits substantial volatility with significant downward pressure over the one-year period, declining 70.25% from previous levels
Report Generated: December 17, 2025
Data Source: Gate Research Database
Disclaimer: This report provides factual market data and does not constitute investment advice or recommendation.
Fluid (FLUID) Investment Analysis Report
Report Date: December 17, 2025
Data Source: Gate Data, Market Analysis
Asset: Fluid (FLUID) Token
I. Executive Summary
Fluid (FLUID) is a lending protocol under the multi-chain DeFi management platform Instadapp. As of December 17, 2025, FLUID trades at $2.835, representing significant year-over-year decline of -70.25% but showing modest 24-hour gains of 0.21%. The token maintains a market capitalization of $283.5 million with a circulating supply of approximately 39.44 million tokens out of 100 million maximum supply.
II. Core Factors Influencing FLUID as an Investment
Supply Mechanism and Scarcity (FLUID Investment Scarcity)
- Maximum Supply Cap: 100 million tokens with 39.44% currently in circulation (39,436,803 tokens), representing a measured inflation schedule
- Scarcity Dynamics: The remaining 60.56% of tokens not yet circulated creates potential supply pressure, though the fixed maximum cap provides predictability for valuation models
- Investment Significance: Fixed supply mechanics support long-term value preservation once circulation stabilizes
Platform Economics and Token Utility (Token Utility Mechanisms)
- Fee Buyback Program: Initiated in August 2025, Fluid channels platform fees toward FLUID token repurchases, creating deflationary pressure and potential value support
- Ecosystem Integration: FLUID functions within Instadapp's multi-chain DeFi infrastructure, providing governance and protocol participation rights
- Competitive Positioning: Unlike lending-only protocols, Fluid offers an integrated platform combining lending, trading, and vaults, potentially strengthening long-term utility demand
Macro Market Environment Impact on FLUID Investment
- Bitcoin Dominance Headwinds: Bitcoin dominance reached 58.45%, creating liquidity constraints for altcoins including FLUID
- Risk-Off Sentiment: Current market conditions show strong bearish trends, with FLUID/USDT trading below $3.067 resistance level as of mid-December 2025
- Liquidity Dynamics: The 318% surge in 24-hour trading volume to $8.77M accompanied by price decline indicates distribution pressure (sellers overwhelming buyers)
Technology and Ecosystem Development (Technology & Ecosystem for FLUID Investment)
- Decentralized Exchange Launch: AMM-based DEX launched in October 2024 with concentrated liquidity features, expanding platform utility beyond lending
- Cross-Chain Infrastructure: Fluid serves as liquidity infrastructure for partner protocols across multiple blockchain networks
- Ecosystem Risk: Partnership with Jupiter Lend faced transparency challenges in December 2025 regarding risk representation, creating reputational spillover effects
III. Market Performance Analysis
Price Action and Technical Indicators
| Metric | Value | Assessment |
|---|---|---|
| Current Price | $2.835 | Below $3.067 resistance |
| 24-Hour Change | +0.21% | Marginal recovery |
| 7-Day Change | -15.03% | Moderate downtrend |
| 30-Day Change | -21.09% | Extended pressure |
| 1-Year Change | -70.25% | Significant decline |
| All-Time High | $11.00 (Sept 24, 2025) | -74.2% from peak |
| All-Time Low | $2.017 (Oct 10, 2025) | +40.7% recovery |
Market Structure
- Market Capitalization: $283.5 million (fully diluted)
- Market Share: 0.0090% of total crypto market
- 24-Hour Trading Volume: $201,080.65
- Exchange Listings: Available on 23 exchanges including Phemex
- Holder Base: 10,985 token holders
IV. Current Market Sentiment and Risk Assessment
Ecosystem-Specific Risks
- Jupiter Lend Controversy (December 7, 2025): Partner protocol Jupiter admitted to misleading "zero contagion" claims regarding lending vault risks, creating trust erosion within Fluid's ecosystem
- Liquidity Infrastructure Exposure: Fluid's position as core liquidity provider to Solana lending protocols creates indirect contagion risk from partner protocol failures
- Competitor Response: Kamino protocol blocked Jupiter's refinancing tools, directly constraining Fluid's cross-chain liquidity flows
Technical Sentiment
- Bearish Trend Strength: Long-term technical analysis indicates strong bearish conditions
- Price Targets: Multiple analyses predict potential downside, with some forecasts suggesting testing of yearly lows near $2.69
- Key Support Level: Maintaining price above $2.69 year-low represents critical holding point
Short to Medium-Term Outlook
- 2025 Price Range Predictions: Analysis forecasts trading between $2.85-$3.73 with average annualized price around $3.03
- Volume Spike Disconnect: Surging volume without price recovery suggests supply exhaustion rather than accumulation
V. Key Metrics Summary
| Category | Data |
|---|---|
| Ranking | #321 by market cap |
| Blockchain | Ethereum (ERC20) |
| Circulating Supply | 39,436,803 FLUID (39.44%) |
| Total Supply | 100,000,000 FLUID |
| Contract Address | 0x6f40d4a6237c257fff2db00fa0510deeecd303eb |
| Website | https://fluid.io/ |
| https://x.com/0xfluid |
VI. Observations
Current market dynamics present mixed signals: the platform fundamentals show ecosystem expansion through DEX launch and fee buyback mechanics, while the macro environment exhibits strong headwinds through Bitcoin dominance and ecosystem controversies. The 70% year-over-year decline reflects both protocol-specific risks and broad altcoin market weakness. Technical indicators show sustained bearish pressure with price remaining below key resistance levels.
The platform's integration into multi-chain DeFi infrastructure provides utility foundations, though recent partnership challenges highlight execution and transparency risks within the ecosystem.
III. FLUID Future Investment Predictions and Price Outlook (Is Fluid(FLUID) worth investing in 2025-2030)
Short-term Investment Prediction (2025, short-term FLUID investment outlook)
- Conservative forecast: $1.64 - $2.84
- Neutral forecast: $2.83 - $3.20
- Optimistic forecast: $3.20 - $3.80
Mid-term Investment Outlook (2026-2027, mid-term Fluid(FLUID) investment forecast)
- Market phase expectation: Gradual protocol maturation with potential protocol-level improvements and ecosystem expansion within the Instadapp multi-chain DeFi management platform
- Investment return forecast:
- 2026: $2.14 - $3.56 (6% potential upside)
- 2027: $3.09 - $4.86 (15% potential upside)
- Key catalysts: Enhanced lending protocol functionality, increased protocol adoption, TVL growth, integration developments within the Instadapp ecosystem
Long-term Investment Outlook (Is Fluid a good long-term investment?)
- Base case scenario: $4.07 - $5.71 by 2028-2029 (assuming steady protocol adoption and stable market conditions)
- Optimistic scenario: $5.71 - $6.56 by 2029-2030 (assuming significant DeFi protocol adoption acceleration and favorable market environment)
- Risk scenario: $2.57 - $3.09 by 2028 (under adverse conditions including protocol adoption challenges or broader market contraction)
View FLUID long-term investment and price prediction: Price Prediction
2025-12-17 to 2030 Long-term Outlook
- Base case scenario: $2.84 - $5.71 USD (corresponding to steady protocol advancement and mainstream DeFi application growth)
- Optimistic scenario: $5.71 - $6.56 USD (corresponding to large-scale DeFi adoption and favorable market environment)
- Transformative scenario: $6.56 USD and above (if ecosystem achieves breakthrough progress and achieves mainstream adoption)
- 2030-12-31 predicted high: $6.56 USD (based on optimistic development assumptions)
Disclaimer: This analysis is based on available market data and does not constitute investment advice. Cryptocurrency markets carry substantial risk, and past performance does not guarantee future results. Investors should conduct their own research and consult financial advisors before making investment decisions.
| 年份 | 预测最高价 | 预测平均价格 | 预测最低价 | 涨跌幅 |
|---|---|---|---|---|
| 2025 | 3.1979 | 2.83 | 1.6414 | 0 |
| 2026 | 3.556461 | 3.01395 | 2.1399045 | 6 |
| 2027 | 4.86210414 | 3.2852055 | 3.08809317 | 15 |
| 2028 | 6.0697456818 | 4.07365482 | 2.5664025366 | 43 |
| 2029 | 6.339625313625 | 5.0717002509 | 4.56453022581 | 78 |
| 2030 | 6.561512199601875 | 5.7056627822625 | 5.36332301532675 | 101 |
Fluid (FLUID) Investment Analysis Report
Report Date: December 17, 2025 Data Source: Gate Data Disclaimer: This report is for informational purposes only and does not constitute investment advice.
I. Project Overview
Basic Information
Fluid is a lending protocol under the multi-chain DeFi management platform Instadapp. The project operates on the Ethereum blockchain with the contract address 0x6f40d4a6237c257fff2db00fa0510deeecd303eb.
Token Specifications
| Metric | Value |
|---|---|
| Token Symbol | FLUID |
| Current Price | $2.835 |
| Market Cap Rank | 321 |
| Total Supply | 100,000,000 |
| Circulating Supply | 39,436,803 (39.44%) |
| Fully Diluted Valuation | $283,500,000 |
| Market Capitalization | $111,803,336.505 |
| Active Holders | 10,985 |
| Trading Pairs | 23 exchanges |
II. Market Performance Analysis
Price Dynamics
Current Status (As of December 17, 2025):
- Current Price: $2.835
- 24-hour Trading Volume: $201,080.65
- Market Dominance: 0.0090%
Price Trends
| Time Period | Change Percentage | Price Change |
|---|---|---|
| 1 Hour | -0.35% | -$0.009957 |
| 24 Hours | +0.21% | +$0.005941 |
| 7 Days | -15.03% | -$0.501472 |
| 30 Days | -21.09% | -$0.757701 |
| 1 Year | -70.25% | -$6.694412 |
Historical Price Levels
- All-Time High: $11.00 (September 24, 2025)
- All-Time Low: $2.017 (October 10, 2025)
- 24-hour Range: $2.827 - $2.919
III. Market Sentiment & Positioning
Market Characteristics
- Market Emotion: Neutral (Score: 1)
- Circulating Ratio: 39.44% of total supply in circulation
- Price Volatility: Significant downward pressure over medium and long-term horizons
Key Observations
The token has experienced substantial depreciation over the 12-month period (-70.25%), indicating a significant decline from its all-time high. However, short-term price action shows stabilization with a marginal positive performance in the 24-hour period (+0.21%).
IV. Investment Strategy and Risk Management
Investment Methodology
Long-term Holding (HODL FLUID):
- Suitable for investors with higher risk tolerance who believe in the Instadapp DeFi ecosystem's long-term potential
- Requires understanding the lending protocol's competitive advantages and adoption trajectory
Active Trading:
- Dependent on technical analysis given price volatility
- Requires monitoring support/resistance levels near $2.817 - $2.919 range
- Wave trading opportunities exist given the 70%+ decline from ATH
Risk Management Framework
Asset Allocation Recommendations:
- Conservative Investors: 0-1% of total portfolio allocation
- Aggressive Investors: 2-5% of speculative allocation
- Institutional Investors: Dependent on DeFi exposure mandate; generally limited due to market cap constraints
Risk Mitigation Strategies:
- Diversification across multiple DeFi protocols and blockchain ecosystems
- Use of stablecoin pairings for volatility hedging
- Regular rebalancing based on portfolio risk parameters
Secure Storage:
- For significant holdings: Hardware wallets (Ledger, Trezor)
- For active trading: Institutional-grade custody solutions
- Avoid extended centralized exchange holdings for security purposes
V. Investment Risks and Challenges
Market Risk
- Extreme Volatility: 70%+ year-to-date decline demonstrates substantial price instability
- Low Liquidity Depth: $201K daily trading volume may constrain large position entry/exit
- Price Correlation Risk: DeFi token price movements often correlate with broader crypto market sentiment
Regulatory Risk
- DeFi Protocol Uncertainty: Ongoing regulatory scrutiny of lending protocols across jurisdictions
- Jurisdiction Variability: Different regulatory treatment in major markets (US, EU, Asia)
- Compliance Evolution: Future regulatory changes could impact protocol functionality or token utility
Technical Risk
- Smart Contract Risk: Lending protocols face inherent smart contract vulnerability exposure
- Operational Risk: Dependency on Instadapp platform stability and development team execution
- Network Risk: Ethereum network congestion or upgrades could impact protocol operations
VI. Conclusion: Is FLUID a Good Investment?
Investment Value Assessment
Fluid presents a specialized investment opportunity within the DeFi lending protocol sector. The project's integration within the Instadapp ecosystem provides access to multi-chain DeFi infrastructure. However, the 70% year-to-date depreciation and current market positioning suggest elevated caution.
Investor Recommendations
✅ Beginner Investors:
- Dollar-cost averaging (DCA) strategy with minimal allocation (0.5-1% of portfolio)
- Mandatory use of hardware wallet storage for any meaningful holdings
- Extended investment horizon (24+ months) to mitigate volatility
✅ Experienced Investors:
- Wave-based trading strategies utilizing support levels near $2.80
- Complementary portfolio positioning with Instadapp ecosystem exposure
- Technical analysis-driven entry/exit execution
✅ Institutional Investors:
- Evaluate strategic allocation only if DeFi protocol diversification aligns with mandate
- Conduct detailed technical due diligence on smart contract audits
- Implement position limits reflecting low liquidity conditions
Critical Warning
⚠️ Risk Disclaimer: Cryptocurrency investment carries substantial risk including potential total capital loss. FLUID exhibits extreme volatility with significant year-to-date depreciation. This analysis is educational only and does not constitute investment advice. Investors must conduct independent research and consult qualified financial advisors before making investment decisions.
Report Prepared: December 17, 2025 Data Accuracy: Valid as of report date and subject to real-time market changes
Fluid (FLUID) Cryptocurrency Investment FAQ
I. What is Fluid (FLUID) and what is its primary function in the DeFi ecosystem?
Answer: Fluid is a lending protocol operating under Instadapp, a multi-chain DeFi management platform. The token (FLUID) is implemented as an ERC20 standard contract on the Ethereum blockchain (contract address: 0x6f40d4a6237c257fff2db00fa0510deeecd303eb). FLUID functions as a governance and participation token within the lending protocol, while the platform itself offers integrated services including lending, trading, and vault management across multiple blockchain networks.
II. What is the current market position and valuation of FLUID as of December 2025?
Answer: As of December 17, 2025, FLUID trades at $2.835 USD with a market capitalization of $111.8 million and a fully diluted valuation of $283.5 million. The token ranks #321 by market cap with approximately 39.44 million tokens in circulation out of a fixed maximum supply of 100 million. The 24-hour trading volume stands at $201,080.65 USD across 23 trading exchanges, with 10,985 active token holders.
III. How has FLUID performed historically, and what are the key price milestones?
Answer: FLUID reached its all-time high of $11.00 on September 24, 2025, and its all-time low of $2.017 on October 10, 2025, representing an 81.7% decline within 16 days. Over the one-year period, FLUID has declined 70.25%. Currently showing modest positive momentum with a 24-hour gain of 0.21%, though the 7-day and 30-day periods show declines of -15.03% and -21.09% respectively, indicating sustained bearish pressure.
IV. What are the key investment risks associated with FLUID?
Answer: FLUID faces multiple risk categories: (1) Market Risk—extreme volatility with 70%+ year-to-date decline and relatively low liquidity depth ($201K daily volume); (2) Technical Risk—dependency on Instadapp platform stability and smart contract vulnerability exposure inherent to lending protocols; (3) Ecosystem Risk—recent partnership challenges with Jupiter Lend regarding transparency in risk representation created reputational spillover; (4) Regulatory Risk—DeFi protocols face ongoing regulatory uncertainty across jurisdictions; (5) Operational Risk—execution challenges in protocol development and ecosystem expansion.
V. What are the projected price targets for FLUID across different timeframes?
Answer: Price predictions vary by timeframe: Short-term (2025): Conservative $1.64-$2.84, Neutral $2.83-$3.20, Optimistic $3.20-$3.80. Mid-term (2026-2027): $2.14-$3.56 in 2026 with 6% upside potential; $3.09-$4.86 in 2027 with 15% upside potential. Long-term (2028-2030): Base case $4.07-$5.71 by 2028-2029; Optimistic scenario $5.71-$6.56 by 2029-2030; Risk scenario $2.57-$3.09 under adverse conditions. By 2030, optimistic projections reach $6.56 USD (101% potential upside from current price).
VI. Is FLUID suitable for conservative investors, and what allocation strategy is recommended?
Answer: FLUID is generally not suitable for conservative investors due to extreme volatility and significant downside risk. Recommended allocation framework: Conservative investors should limit exposure to 0-1% of total portfolio; Aggressive investors may allocate 2-5% of speculative allocation; Institutional investors should evaluate only if DeFi protocol diversification aligns with specific mandates. Beginner investors should employ dollar-cost averaging with minimal allocation (0.5-1%) and mandatory hardware wallet storage for security purposes.
VII. What are the primary catalysts that could drive FLUID's future value appreciation?
Answer: Key positive catalysts include: (1) Enhanced lending protocol functionality improvements within the Instadapp ecosystem; (2) Increased protocol adoption and total value locked (TVL) growth; (3) Successful decentralized exchange (AMM-based DEX launched October 2024) expansion and usage; (4) Fee buyback program initiated in August 2025 creating deflationary token mechanics; (5) Cross-chain infrastructure expansion strengthening Fluid's position as core liquidity provider; (6) Favorable macro market environment with Bitcoin dominance normalization; (7) Successful resolution of ecosystem partnership challenges and restored market confidence. However, current ecosystem controversies and macro headwinds present significant near-term headwinds to value appreciation.
VIII. What storage and risk management strategies should FLUID investors implement?
Answer: For significant holdings exceeding $5,000, use hardware wallets (Ledger, Trezor) for maximum security. For active trading positions, utilize institutional-grade custody solutions with established track records. Avoid extended centralized exchange holdings. Implement portfolio diversification across multiple DeFi protocols and blockchain ecosystems to reduce single-protocol risk. Use stablecoin pairings for volatility hedging. Establish position size limits based on overall portfolio risk parameters—FLUID should represent no more than 1-5% of total portfolio allocation depending on risk tolerance. Conduct regular rebalancing based on market conditions and maintain an extended investment horizon of 24+ months to mitigate short-term volatility impacts.
Report Date: December 17, 2025
Disclaimer: This FAQ is for informational and educational purposes only and does not constitute investment advice, financial recommendation, or solicitation to invest. Cryptocurrency investments carry substantial risk including potential total capital loss. Investors must conduct independent research and consult qualified financial advisors before making investment decisions.
Share
How to Buy Cryptocurrency


Trending Cryptocurrencies


XZXX: A Comprehensive Guide to the BRC-20 Meme Token in 2025
Bitcoin Fear and Greed Index: Market Sentiment Analysis for 2025
Top Crypto ETFs to Watch in 2025: Navigating the Digital Asset Boom

5 ways to get Bitcoin for free in 2025: Newbie Guide

Bitcoin Market Cap in 2025: Analysis and Trends for Investors

2025 Bitcoin Price Prediction: Trump's Tariffs' Impact on BTC

How does Federal Reserve policy and inflation impact crypto prices in 2025?

How Much Will TIBBIR Price Be in 2025: Historical Trends, Support and Resistance Levels, and Volatility Analysis
From the GENIUS Act to New FDIC Rules: The Era of Bank-Issued Stablecoins in the U.S. Is Approaching

How Does On-Chain Data Analysis Reveal Stable Blockchain's 24,000+ Active Addresses and USDT Transaction Trends?

Bitcoin and Ethereum ETF Outflows: What Investors Need to Know About Market Shifts in 2024
