Is Kadena (KDA) a good investment?: A comprehensive analysis of potential returns, risks, and market outlook for 2024


Introduction: Kadena (KDA) Investment Position and Market Prospects
Kadena (KDA) is an important asset in the cryptocurrency field. As a leader in distributed digital ledgers, it has positioned itself as an industry-leading secure and scalable platform with a simple smart contract language. The project offers both public chain and alliance chain solutions, with the alliance chain capable of integrating with the public chain network to create new market use cases.
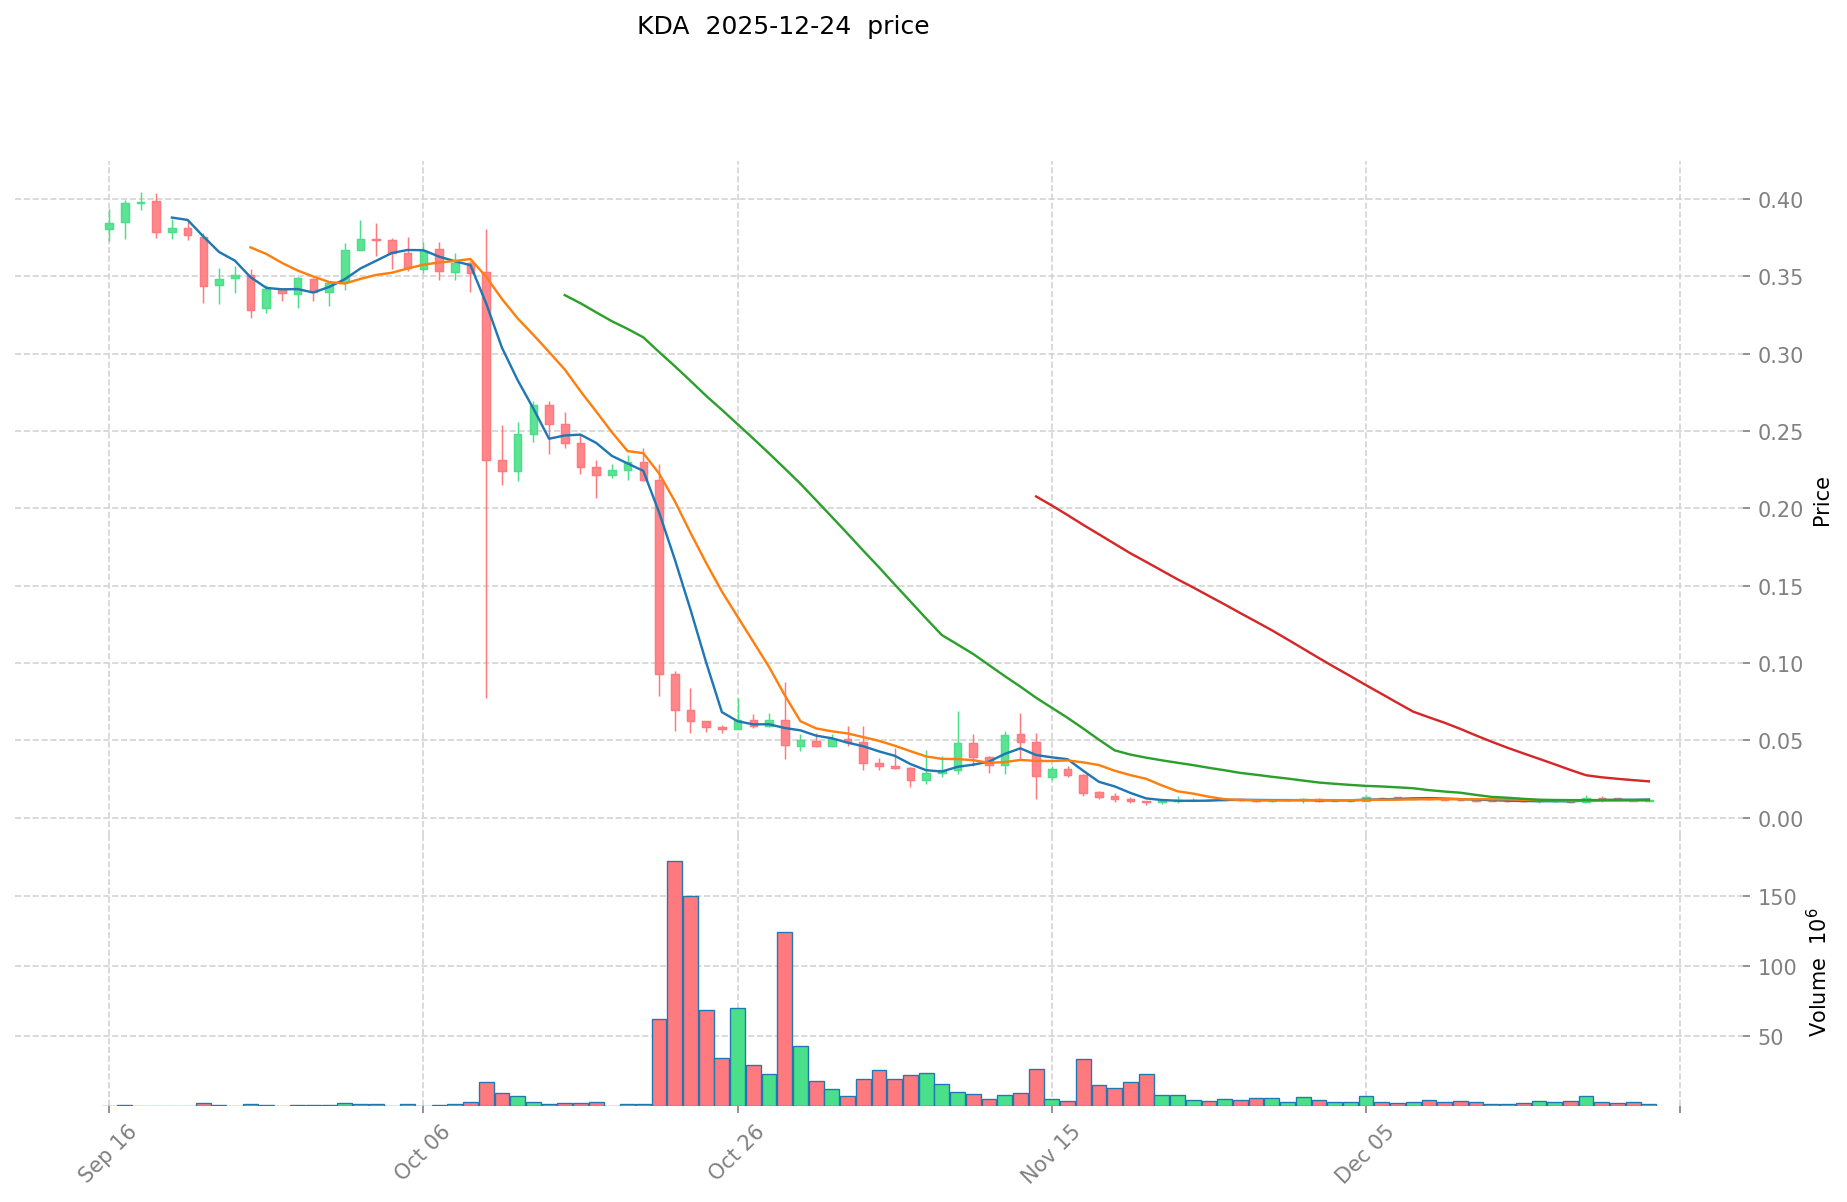
As of December 24, 2025, KDA maintains a market capitalization of approximately $3.84 million USD, with a circulating supply of around 338.59 million tokens and a current price of $0.01134. The token has a maximum supply of 1 billion KDA, representing 33.86% circulation ratio. Having secured $15 million in financing from institutions including SVAngel and CoinFund, Kadena has established itself as a noteworthy project in the blockchain infrastructure sector.
KDA has experienced significant price volatility since its inception, reaching an all-time high of $27.64 on November 11, 2021, and recently trading near its all-time low of $0.00842517. This dramatic price movement reflects the broader volatility within the crypto market and the project's evolving market dynamics.
This article provides a comprehensive analysis of KDA's investment value, historical price performance, future price projections, and associated investment risks, offering investors a detailed reference for evaluating this cryptocurrency asset.
Kadena (KDA) Crypto Asset Research Report
I. Kadena (KDA) Historical Price Review and Current Investment Value
KDA Historical Price Trends and Investment Returns
Based on available data, Kadena has experienced significant price volatility since its launch:
- November 2021: All-Time High (ATH) of $27.64 was reached on November 11, 2021
- November 2025: All-Time Low (ATL) of $0.00842517 was recorded on November 21, 2025
- One-Year Performance: Declined approximately 98.9% from the previous year
- Price Trajectory: From the historical peak to current levels represents a substantial contraction in asset valuation
Current Kadena Investment Market Status (December 24, 2025)
- Current KDA Price: $0.01134
- Market Capitalization: $3,839,566.19
- Circulating Supply: 338,586,083.52 KDA
- Total Supply: 338,586,083.52 KDA
- Maximum Supply: 1,000,000,000 KDA
- Circulating Supply Ratio: 33.86%
- Market Dominance: 0.00012%
Price Performance Metrics
| Time Period | Price Change | Change Amount |
|---|---|---|
| 1 Hour | +2.56% | +$0.000283 |
| 24 Hours | +2.09% | +$0.000232 |
| 7 Days | +3.59% | +$0.000393 |
| 30 Days | -2.18% | -$0.000253 |
| 1 Year | -98.9% | -$1.0196 |
- 24-Hour Trading Volume: $20,055.68
- 24-Hour High: $0.01168
- 24-Hour Low: $0.0106
- Fully Diluted Valuation (FDV): $3,839,566.19
For real-time KDA market pricing, visit Gate.com - Kadena
II. Project Overview and Technical Architecture
Project Introduction
Kadena is a leader in distributed digital ledgers, offering an industry-leading secure and scalable platform with a simple smart contract language. The project utilizes blockchain technology to help institutions improve operational efficiency.
Kadena features both public chain and alliance chain solutions, with the alliance chain capable of integration with the public chain network, creating new market use cases. The project has received $15 million in funding from institutional investors including SVAngel and CoinFund.
Platform Resources
- Official Website: http://kadena.io
- Block Explorer: https://explorer.chainweb-community.org/mainnet
- White Papers: https://docs.kadena.io/basics/whitepapers/overview
- GitHub Repositories:
- Community Channels:
- Twitter: https://twitter.com/kadena_io
- Reddit: https://www.reddit.com/r/kadena/
- Facebook: https://www.facebook.com/KadenaBlockchain
III. Token Economics
Supply Structure
- Circulating Supply: 338,586,083.52 KDA (33.86% of maximum supply)
- Maximum Supply Cap: 1,000,000,000 KDA
- Current Distribution: Fully diluted valuation equals current market cap, indicating all tokens are considered in valuation calculations
Market Liquidity
- Primary Exchange Presence: Listed on 2 exchanges
- 24-Hour Trading Volume: $20,055.68 USD
- Market Depth: Relatively modest trading volumes indicate limited liquidity
Report Generated: December 24, 2025 Data Source: Gate Crypto Asset Database
Kadena (KDA) Investment Analysis Report
Report Date: December 24, 2025
I. Executive Summary
Kadena (KDA) is currently trading at $0.01134 with a market capitalization of approximately $3.84 million USD. The token has experienced significant depreciation, declining 98.9% over the past year from historical highs of $27.64 reached in November 2021. Current market sentiment indicators suggest a bearish outlook for the near term, with technical analysis pointing to challenging conditions for potential investors.
II. Core Factors Affecting Whether Kadena (KDA) is a Good Investment
Supply Mechanism and Scarcity (KDA Investment Scarcity)
- Current Supply Status: Kadena has a circulating supply of 338,586,083.5196 KDA tokens against a maximum supply cap of 1,000,000,000 KDA, representing 33.86% of total possible supply currently in circulation.
- Supply Dynamics: The significant gap between circulating and maximum supply indicates substantial future dilution potential, which may exert downward pressure on token valuation as additional tokens enter circulation.
Market Positioning and Adoption
- Current Market Position: Kadena ranks 1,706th by market capitalization, with a market dominance of only 0.00012%, indicating minimal market share among cryptocurrencies.
- Institutional Support: The project has secured $15 million in funding from notable venture capital firms including SVAngel and CoinFund, demonstrating some level of institutional confidence in the underlying technology and vision.
Technology and Ecosystem Development (Technology & Ecosystem for Kadena Investment)
- Platform Architecture: Kadena is positioned as a leader in distributed digital ledgers, offering both public chain and alliance chain solutions. The alliance chain capability can integrate with public networks, creating hybrid deployment scenarios for enterprise use cases.
- Smart Contract Language: The platform features a simplified smart contract language designed to reduce complexity and improve developer accessibility, potentially supporting broader ecosystem adoption.
- Development Infrastructure: Active GitHub repositories for core components (chainweb-node, Pact smart contract language, and Chainweaver wallet) indicate ongoing technical development and community engagement.
III. Current Market Performance Metrics
| Metric | Value |
|---|---|
| Current Price (USD) | $0.01134 |
| 24-Hour Change | +2.09% |
| 1-Hour Change | +2.56% |
| 7-Day Change | +3.59% |
| 30-Day Change | -2.18% |
| 1-Year Change | -98.9% |
| All-Time High | $27.64 (November 11, 2021) |
| All-Time Low | $0.00842517 (November 21, 2025) |
| 24-Hour Volume | $20,055.68 |
| Market Cap | $3,839,566.19 |
IV. Technical Analysis and Market Sentiment
- Short-Term Momentum: Recent hourly and daily price movements show modest positive momentum (+2.56% and +2.09% respectively), though this represents recovery from depressed levels rather than strong bullish conviction.
- Medium-Term Weakness: The 30-day decline of -2.18% indicates persistent downward pressure over intermediate timeframes.
- Long-Term Deterioration: The 98.9% annual decline from historical valuations represents one of the most severe drawdowns in the token's history.
- Technical Indicators: Multiple sources indicate the token is trading below the 50-day simple moving average, generating "sell signals" in technical analysis frameworks.
V. Risk Factors and Considerations
- Extreme Historical Drawdown: The 98.9% decline from all-time highs represents exceptional downside risk materialization and indicates market skepticism regarding the project's value proposition relative to initial expectations.
- Minimal Market Adoption: The 0.00012% market dominance suggests limited mainstream adoption or integration into the broader cryptocurrency ecosystem.
- Supply Dilution Risk: The remaining 662 million tokens representing 66.14% of maximum supply may create sustained selling pressure as tokens are released into circulation.
- Low Trading Volume: Daily volume of $20,055.68 indicates limited market liquidity, which may amplify price volatility during trading activity.
VI. Disclaimer
This report presents factual market data and observable metrics regarding Kadena (KDA). It does not constitute financial advice, investment recommendation, or endorsement of any investment position. The cryptocurrency market carries substantial risk, and individual investors should conduct independent research and consult with qualified financial advisors before making investment decisions.
VII. Information Sources
- Official Website: http://kadena.io
- Block Explorer: https://explorer.chainweb-community.org/mainnet
- Technical Documentation: https://docs.kadena.io/basics/whitepapers/overview
- Social Channels: Twitter (@kadena_io), Reddit (/r/kadena), Facebook (KadenaBlockchain)
- Development Repositories: GitHub (chainweb-node, Pact, Chainweaver)
III. KDA Future Investment Predictions and Price Outlook
Short-term Investment Predictions (2025, short-term KDA investment outlook)
- Conservative forecast: $0.0060 - $0.0110
- Neutral forecast: $0.0110 - $0.0145
- Optimistic forecast: $0.0145 - $0.0165
Mid-term Investment Outlook (2026-2028, mid-term Kadena(KDA) investment forecast)
-
Market phase expectations: KDA is anticipated to experience gradual consolidation and modest recovery as the platform develops its Chainweb EVM capabilities and institutional adoption infrastructure, with potential volatility based on broader market conditions.
-
Investment return predictions:
- 2026: $0.0071 - $0.0146
- 2027: $0.0074 - $0.0150
- 2028: $0.0092 - $0.0150
-
Key catalysts: Chainweb EVM testnet adoption, institutional real-world asset tokenization integration with partners like Brickken, developer ecosystem expansion through the $500,000 grant program, and broader blockchain infrastructure maturation.
Long-term Investment Outlook (Is Kadena a good long-term investment?)
-
Base case scenario: $0.016 - $0.022 USD (assuming steady platform development, moderate ecosystem growth, and stable regulatory environment through 2030)
-
Optimistic scenario: $0.022 - $0.050 USD (assuming accelerated adoption of public-private chain integration, successful institutional RWA tokenization deployment, and mainstream blockchain recognition)
-
Risk scenario: $0.005 - $0.010 USD (under conditions of prolonged market downturn, competitive pressures from alternative platforms, or regulatory headwinds)
For additional information on KDA long-term investment and price forecasts, visit: Price Forecast
2025-12-24 to 2030 Long-term Outlook
-
Base case scenario: $0.016 - $0.022 USD (corresponding to steady platform development and gradual mainstream application growth)
-
Optimistic scenario: $0.022 - $0.050 USD (corresponding to large-scale adoption and favorable market environment)
-
Transformative scenario: $0.100 USD and above (should ecosystem achieve breakthrough progress and achieve mainstream adoption)
-
2030-12-31 predicted high: $0.0216 USD (based on optimistic development assumptions)
Disclaimer: These forecasts are based on historical data patterns and statistical models, which do not guarantee future performance. Cryptocurrency markets are highly volatile and subject to rapid changes. Past performance does not indicate future results. This analysis is for informational purposes only and should not be construed as investment advice. Please conduct your own due diligence before making investment decisions.
| 年份 | 预测最高价 | 预测平均价格 | 预测最低价 | 涨跌幅 |
|---|---|---|---|---|
| 2025 | 0.0164575 | 0.01135 | 0.0060155 | 0 |
| 2026 | 0.0145989375 | 0.01390375 | 0.0070909125 | 22 |
| 2027 | 0.0149639109375 | 0.01425134375 | 0.00741069875 | 25 |
| 2028 | 0.015045856164062 | 0.01460762734375 | 0.009202805226562 | 28 |
| 2029 | 0.017643822687148 | 0.014826741753906 | 0.009192579887421 | 30 |
| 2030 | 0.021592925353301 | 0.016235282220527 | 0.008279993932468 | 43 |
Kadena (KDA) Investment Analysis Report
I. Project Overview
Basic Information
Kadena is a leader in distributed digital ledger technology, offering an industry-leading secure and scalable platform with a simple smart contract language. The project uses blockchain to help institutions improve operational efficiency.
Project Characteristics:
- Dual-solution architecture: both public chain and alliance chain solutions
- Integration capability: Kadena's alliance chain can be integrated with the public chain network to create new market use cases
- Funding background: USD 15 million in financing from institutions including SVAngel and CoinFund
Token Metrics (as of December 24, 2025)
| Metric | Value |
|---|---|
| Current Price | $0.01134 |
| Market Capitalization | $3,839,566.19 |
| Fully Diluted Valuation | $3,839,566.19 |
| Circulating Supply | 338,586,083.52 KDA |
| Total Supply | 338,586,083.52 KDA |
| Maximum Supply | 1,000,000,000 KDA |
| Market Rank | 1,706 |
| Market Dominance | 0.00012% |
Price Performance
| Period | Change |
|---|---|
| 1 Hour | +2.56% |
| 24 Hours | +2.09% |
| 7 Days | +3.59% |
| 30 Days | -2.18% |
| 1 Year | -98.9% |
Historical Price Range:
- All-Time High: $27.64 (November 11, 2021)
- All-Time Low: $0.00842517 (November 21, 2025)
- 24-Hour Range: $0.0106 - $0.01168
II. Market Analysis
Liquidity & Trading Volume
- 24-Hour Trading Volume: $20,055.68
- Circulating/Maximum Supply Ratio: 33.86%
Market Position
Kadena currently ranks 1,706 by market capitalization, indicating a relatively small position within the broader cryptocurrency market. The project maintains minimal market dominance at 0.00012%.
III. Investment Strategy and Risk Management
Investment Methodology
Long-Term Holding (HODL KDA):
- Suitable for investors with conviction in Kadena's dual-chain architecture and institutional solutions
- Appropriate for those seeking exposure to blockchain infrastructure platforms
Active Trading:
- Dependent on technical analysis and price momentum
- Given the 24-hour volatility of +2.09%, short-term trading opportunities may exist
- Requires careful monitoring of support and resistance levels near recent trading ranges
Risk Management
Asset Allocation Framework:
- Conservative investors: 1-3% portfolio allocation to KDA
- Moderate investors: 3-5% portfolio allocation
- Experienced traders: Position sizing based on technical indicators and risk tolerance
Risk Mitigation Strategies:
- Portfolio diversification across multiple blockchain projects
- Use of stop-loss orders to limit downside exposure
- Consideration of hedging instruments when appropriate
Secure Storage:
- Cold wallet storage for long-term holdings
- Hardware wallet solutions for enhanced security
- Multi-signature arrangements for significant holdings
IV. Investment Risks and Challenges
Market Risk
- Extreme volatility: 98.9% decline over the past year indicates substantial price fluctuation
- Small trading volumes ($20,055.68 in 24 hours) may result in significant price impact from large trades
- Current price represents 95.9% decline from all-time high
Regulatory Risk
- Regulatory landscape remains uncertain across different jurisdictions
- Changes in blockchain regulation could impact project viability and token utility
Technical Risk
- Platform security and network stability considerations
- Execution risk of technical upgrades and network improvements
- Dependency on developer ecosystem adoption
V. Conclusion: Is Kadena a Good Investment?
Investment Value Summary
Kadena's long-term investment potential is contingent upon successful execution of its dual-chain solutions and institutional adoption. However, the 98.9% year-over-year decline and significant gap between current price and all-time high present substantial historical challenges.
Investor Recommendations
✅ Beginners: Consider dollar-cost averaging with small allocations; prioritize cold wallet storage for security
✅ Experienced Traders: Technical analysis-based position trading; maintain disciplined portfolio allocation
✅ Institutional Investors: Strategic evaluation of Kadena's institutional solutions and alliance chain differentiation; longer-term conviction horizon
⚠️ Disclaimer: Cryptocurrency investments carry substantial risk including potential total loss of capital. This report is provided for informational purposes only and does not constitute investment advice. Conduct independent research and consult with qualified financial advisors before making investment decisions.
Kadena (KDA) Cryptocurrency Investment Analysis Report
I. Executive Summary
Kadena (KDA) is a distributed digital ledger platform offering both public and alliance chain solutions. As of December 24, 2025, KDA trades at $0.01134 with a market capitalization of $3.84 million USD. The token has experienced a severe 98.9% annual decline from its all-time high of $27.64 in November 2021, currently ranking 1,706th by market capitalization with minimal market dominance of 0.00012%.
II. Project Overview and Technical Foundation
Kadena positions itself as a leader in distributed digital ledgers, offering an industry-leading secure and scalable platform with simplified smart contract language. The project features both public chain and alliance chain solutions, with the latter capable of integration with public networks to create enterprise-focused use cases.
Key Highlights:
- Institutional backing: $15 million in financing from SVAngel and CoinFund
- Dual-solution architecture enabling hybrid deployment scenarios
- Development infrastructure: Active repositories for chainweb-node, Pact smart contracts, and Chainweaver wallet
- Target market: Institutions seeking blockchain solutions for operational efficiency improvement
III. Current Market Metrics (December 24, 2025)
| Metric | Value |
|---|---|
| Current Price | $0.01134 USD |
| Market Capitalization | $3,839,566.19 |
| Circulating Supply | 338,586,083.52 KDA (33.86% of max supply) |
| Maximum Supply | 1,000,000,000 KDA |
| 24-Hour Trading Volume | $20,055.68 |
| 24-Hour Price Change | +2.09% |
| 7-Day Price Change | +3.59% |
| 1-Year Price Change | -98.9% |
IV. Price Performance and Historical Context
Historical Price Range:
- All-Time High: $27.64 (November 11, 2021)
- All-Time Low: $0.00842517 (November 21, 2025)
- Current Position: 95.9% below all-time high
Recent Performance Trends:
- Positive momentum: 1-hour (+2.56%) and 24-hour (+2.09%) changes indicate recent recovery
- Medium-term weakness: 30-day decline of -2.18%
- Severe long-term deterioration: 98.9% annual decline represents substantial value contraction
V. Price Forecast Analysis
Short-Term Outlook (2025)
- Conservative scenario: $0.0060 - $0.0110
- Neutral scenario: $0.0110 - $0.0145
- Optimistic scenario: $0.0145 - $0.0165
Mid-Term Forecast (2026-2028)
| Year | Low | High | Midpoint |
|---|---|---|---|
| 2026 | $0.0071 | $0.0146 | $0.0109 |
| 2027 | $0.0074 | $0.0150 | $0.0112 |
| 2028 | $0.0092 | $0.0150 | $0.0121 |
Long-Term Outlook (2030)
- Base case: $0.016 - $0.022 USD
- Optimistic case: $0.022 - $0.050 USD
- Risk case: $0.005 - $0.010 USD
- Predicted high by 2030: $0.0216 USD
VI. Risk Factors and Investment Considerations
Market Risks:
- Extreme volatility: 98.9% historical decline indicates substantial price fluctuation risk
- Limited liquidity: $20,055.68 daily trading volume may amplify price impact from significant trades
- Minimal market adoption: 0.00012% market dominance suggests limited ecosystem integration
Token Supply Risks:
- Supply dilution: 662 million tokens (66.14% of maximum supply) remain unreleased
- Potential downward pressure as additional tokens enter circulation
Technical and Regulatory Risks:
- Platform security and network stability execution
- Regulatory uncertainty across different jurisdictions
- Competitive pressures from alternative blockchain platforms
VII. FAQ
Q1: What is Kadena (KDA) and what makes it different from other blockchain platforms?
A: Kadena is a distributed digital ledger platform offering both public chain and alliance chain solutions with a simplified smart contract language (Pact). Its unique value proposition includes hybrid deployment capability where alliance chains can integrate with the public network, creating enterprise-use-case scenarios. The platform targets institutional adoption for operational efficiency improvement, supported by $15 million in funding from venture capital firms including SVAngel and CoinFund.
Q2: Why has KDA experienced such a severe price decline from its November 2021 high?
A: KDA has declined 98.9% from its all-time high of $27.64 in November 2021 to current levels near $0.01134. This dramatic contraction reflects broader cryptocurrency market cycles, unfulfilled expectations relative to initial valuations, limited mainstream adoption (0.00012% market dominance), and supply dilution concerns. The 66.14% of maximum supply remaining unreleased represents additional downward pressure potential.
Q3: Is Kadena a good long-term investment opportunity?
A: Kadena's long-term investment potential depends on successful execution of its dual-chain solutions and institutional adoption. Base case modeling suggests $0.016-$0.022 USD by 2030, while optimistic scenarios project $0.022-$0.050 USD. However, the 98.9% historical decline and 95.9% drawdown from all-time highs indicate substantial risk. The project requires meaningful progress in Chainweb EVM capabilities and institutional real-world asset tokenization adoption to justify increased valuations. Long-term investors should assess their conviction in these catalysts.
Q4: What are the key catalysts that could drive KDA price appreciation?
A: Potential positive catalysts include: (1) Chainweb EVM testnet adoption and implementation, (2) Institutional real-world asset (RWA) tokenization integration with partners like Brickken, (3) Developer ecosystem expansion through $500,000 grant programs, (4) Successful public-private chain integration use cases, and (5) Broader mainstream blockchain infrastructure recognition and regulatory clarity. Achievement of these milestones could support transition from base-case to optimistic price scenarios.
Q5: What is the current liquidity situation for KDA, and what does it mean for investors?
A: KDA exhibits limited trading liquidity with 24-hour volume of only $20,055.68 USD across 2 exchanges. Low liquidity creates several challenges: (1) Significant price impact from moderate-sized trades, (2) Wider bid-ask spreads increasing transaction costs, (3) Difficulty entering or exiting large positions without substantial slippage, and (4) Amplified volatility during periods of market stress. Investors should consider position sizing carefully and utilize limit orders to manage execution risk.
Q6: How should investors approach portfolio allocation for KDA given its risk profile?
A: Conservative investors should limit KDA allocation to 1-3% of total cryptocurrency holdings, utilizing dollar-cost averaging strategies over time. Moderate investors may consider 3-5% allocation with technical analysis-based entry points near support levels. Experienced traders may employ higher allocations with disciplined stop-loss orders and hedging strategies. All investors should prioritize secure cold wallet storage for long-term holdings and implement portfolio diversification across multiple blockchain projects. This risk-managed approach acknowledges KDA's potential while containing downside exposure.
Q7: What does the current supply distribution tell us about future price pressure?
A: Kadena has 338.59 million tokens in circulation (33.86% of 1 billion maximum supply), with 661.41 million tokens (66.14%) remaining unreleased. This significant supply overhang creates structural downward pressure as additional tokens gradually enter circulation. Investors should monitor token release schedules closely, as accelerated supply growth without proportional demand increases typically exerts negative price pressure. The supply dynamics represent a material long-term risk factor requiring ongoing evaluation.
Q8: What are the key differences between conservative, moderate, and optimistic price forecasts for KDA?
A: The three-scenario approach reflects different assumptions about platform adoption and market conditions. Conservative scenarios ($0.005-$0.011 USD by 2030) assume regulatory headwinds and limited adoption relative to competitive platforms. Moderate scenarios ($0.016-$0.022 USD) project steady platform development and gradual ecosystem growth under stable regulatory environments. Optimistic scenarios ($0.022-$0.050+ USD) assume accelerated adoption of public-private integration, successful institutional RWA deployment, and mainstream blockchain recognition. Investors should align scenario selection with their conviction level in Kadena's competitive positioning and execution capabilities.
VIII. Important Disclaimer
This report presents factual market data and observable metrics regarding Kadena (KDA). It does not constitute financial advice, investment recommendation, or endorsement of any investment position. Cryptocurrency investments carry substantial risk including potential total loss of capital. Past performance does not indicate future results. Price forecasts are based on historical patterns and statistical models without guarantee of accuracy. Investors should conduct independent research and consult with qualified financial advisors before making investment decisions.
Report Generated: December 24, 2025
Data Source: Gate Cryptocurrency Database
Share
How to Buy Cryptocurrency


Trending Cryptocurrencies


2025 WHITEPrice Prediction: Analysis of Market Trends and Future Value Potential

SIX vs QNT: Analyzing Performance Metrics of Two Leading Blockchain Technology Platforms

EL vs HBAR: Comparing the Performance and Applications of Different Quantum Computing Architectures

2025 BST Price Prediction: Analyzing Market Trends and Potential Growth Factors

What Will ONDO Price Be in 2025? Analyzing Historical Trends and Market Predictions

2025 PLUME Price Prediction: Analyzing Market Trends and Potential Growth Factors for the Emerging Cryptocurrency

How to Measure Crypto Community and Ecosystem Activity: Twitter Followers, Developer Contribution, and DApp Growth
Is Basenji (BENJI) a good investment?: A Comprehensive Analysis of Price Potential, Market Fundamentals, and Risk Factors for 2024
Is XL1 (XL1) a good investment?: A Comprehensive Analysis of Market Performance, Risk Factors, and Future Growth Potential

Is Thetanuts Finance (NUTS) a good investment?: A Comprehensive Analysis of Returns, Risks, and Market Potential

How to Analyze On-Chain Data: Active Addresses, Whale Movements, and Transaction Value Trends in 2025