LON vs ARB: A Comprehensive Comparison of Two Leading Layer 2 Solutions in the Ethereum Ecosystem
Introduction: LON vs ARB Investment Comparison
In the cryptocurrency market, the comparison between Tokenlon (LON) and Arbitrum (ARB) is a topic investors cannot avoid. The two assets demonstrate significant differences not only in market capitalization ranking, application scenarios, and price performance, but also represent distinct positioning within the crypto ecosystem.
Tokenlon (LON): Since its launch, it has gained market recognition as a decentralized transaction payment and settlement protocol, serving as an application token that incentivizes network participants and ecosystem builders while providing governance rights to the community.
Arbitrum (ARB): Since its introduction, it has been recognized as an Ethereum scaling solution enabling high-throughput, low-cost smart contracts while maintaining trustless security. ARB serves as the governance token for the Arbitrum ecosystem.
This article will comprehensively analyze the investment value comparison between LON and ARB across market position, price performance, token supply mechanisms, ecosystem adoption, and technical infrastructure, while attempting to answer the question investors care most about:
"Which is the better buy right now?"
Comparative Analysis Report: Tokenlon (LON) and Arbitrum (ARB)
I. Historical Price Comparison and Current Market Status
Price Trajectories of LON and ARB
Tokenlon (LON):
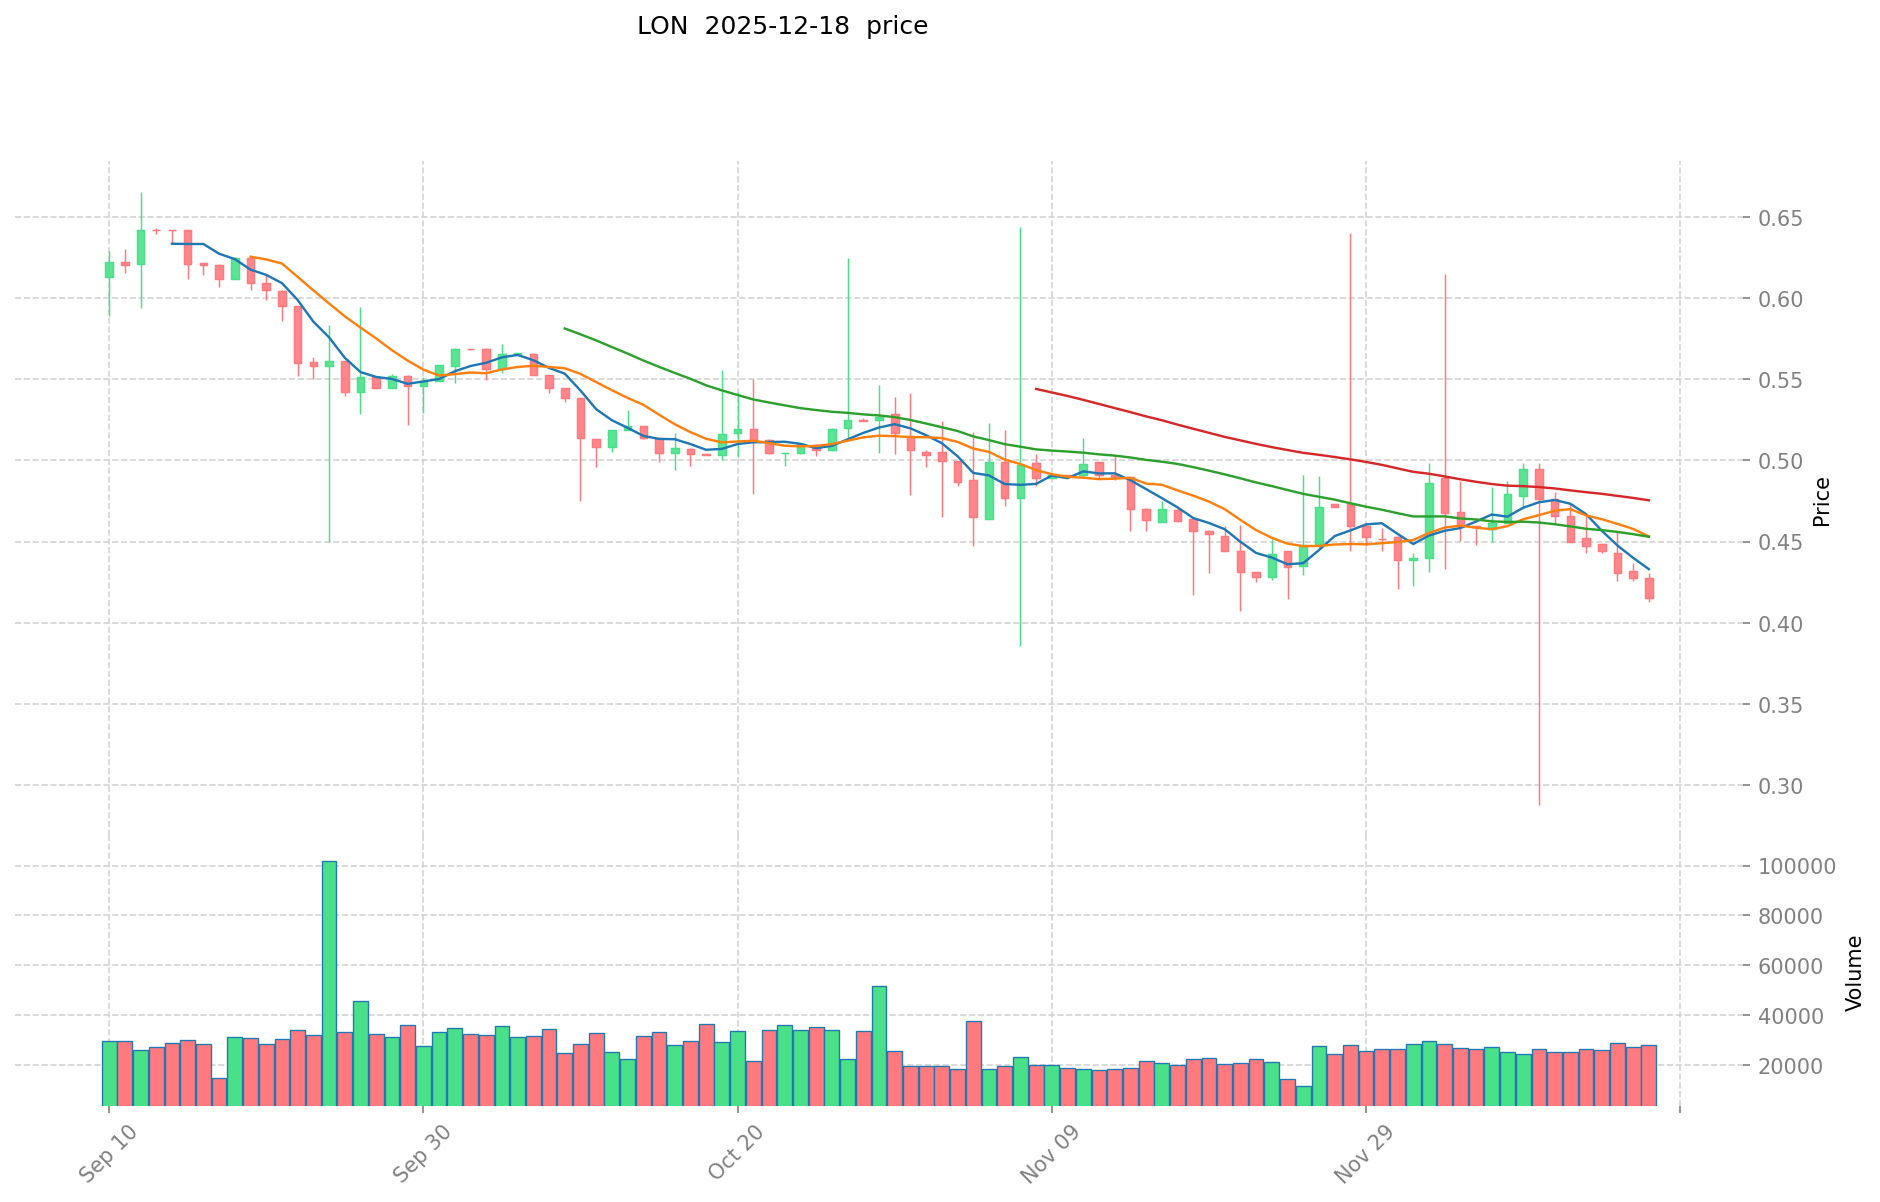
- All-time high: $9.81 (January 31, 2021)
- All-time low: $0.371875 (June 12, 2023)
- Current price: $0.4106
- 12-month performance: -49.8%
Arbitrum (ARB):
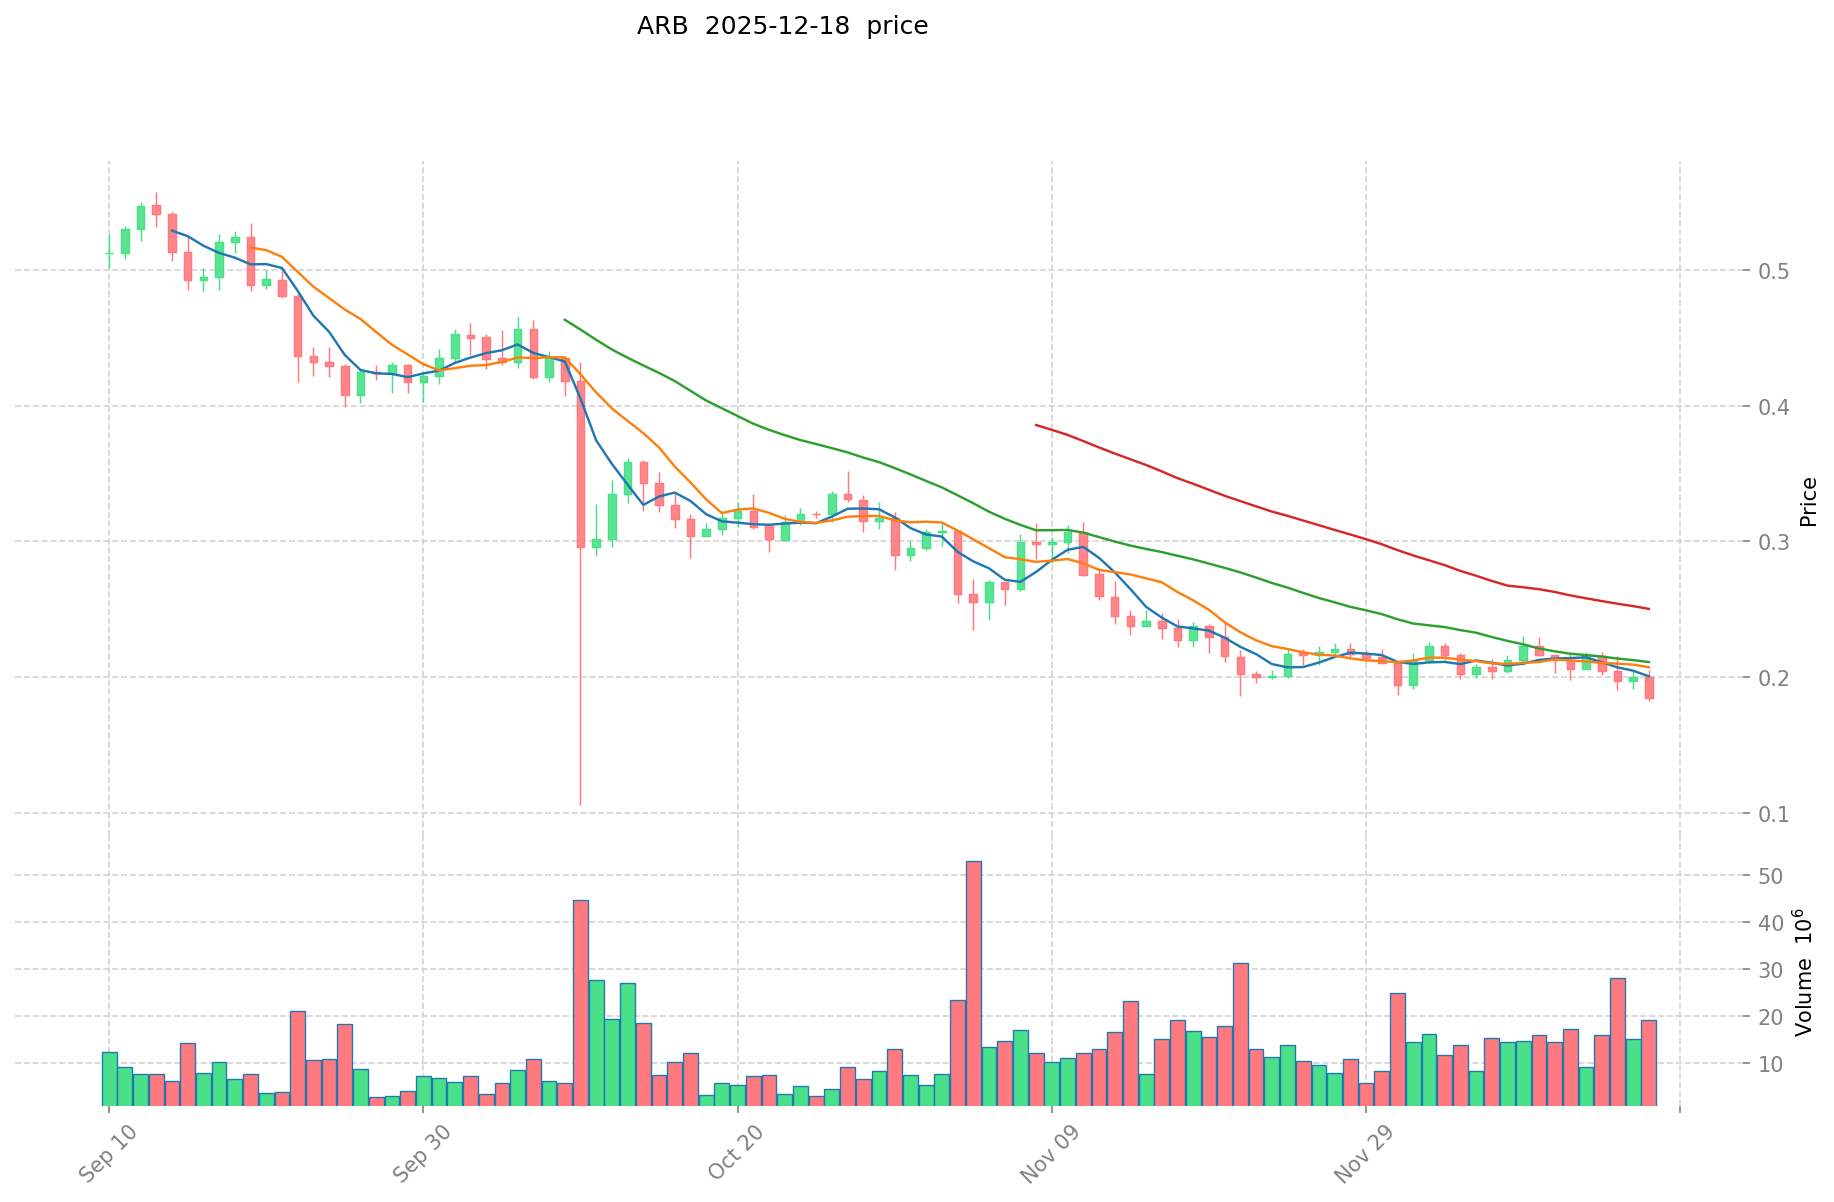
- All-time high: $2.39 (January 12, 2024)
- All-time low: $0.180333 (December 18, 2025)
- Current price: $0.1828
- 12-month performance: -80.73%
Comparative Analysis
Both tokens have experienced significant depreciation over their respective periods. LON has declined from its 2021 peak of $9.81 to current levels of $0.41, representing a 95.8% decline from all-time highs. ARB, despite launching later in 2023, has deteriorated from its 2024 peak of $2.39 to $0.18, representing a 92.4% decline from its all-time high. ARB demonstrates more severe recent losses, reaching its all-time low on the current reporting date.
Current Market Status (December 18, 2025)
| Metric | LON | ARB |
|---|---|---|
| Current Price | $0.4106 | $0.1828 |
| 24H Trading Volume | $17,523.95 | $3,871,516.03 |
| Market Cap | $50.82M | $1,045.49M |
| Fully Diluted Valuation | $57.67M | $1,828M |
| Market Ranking | #498 | #80 |
| Circulating Supply | 123.77M LON | 5.72B ARB |
| 24H Price Change | -3.63% | -6.72% |
| 7-Day Price Change | -11.21% | -10.91% |
Cryptocurrency Fear & Greed Index: 17 (Extreme Fear)
Market data reflects data as of December 18, 2025, 17:09:23 UTC.
Real-time price information:
- Tokenlon (LON) market data available at official exchanges
- Arbitrum (ARB) market data available at official exchanges
II. Project Overview and Utility
Tokenlon (LON)
Tokenlon is a decentralized transaction payment and settlement protocol built on blockchain networks. LON serves as the governance and utility token within the Tokenlon ecosystem.
Token Utility:
- Incentivization: Rewards for Tokenlon transaction users and ecosystem builders
- Transaction Discounts: LON holders receive service fee discounts on the platform
- Governance: Community participation rights in Tokenlon protocol governance (governance module activation timeline and execution rules to be announced)
Supply Metrics:
- Circulating Supply: 123,772,712 LON (61.89% of total supply)
- Total Supply: 140,451,029 LON
- Maximum Supply: 200,000,000 LON
Arbitrum (ARB)
Arbitrum is an Ethereum scaling solution providing high-throughput, low-cost smart contract execution while maintaining trustless security. Three operational modes exist: AnyTrust Channels, AnyTrust Sidechains, and Arbitrum Rollup.
ARB functions as the governance token for the Arbitrum ecosystem.
Supply Metrics:
- Circulating Supply: 5,719,286,371 ARB (57.19% of total supply)
- Total Supply: 10,000,000,000 ARB
- Maximum Supply: 10,000,000,000 ARB
Token Distribution:
- ArbitrumDAO Treasury: 42.78%
- Offchain Labs Team and Advisors: 26.94%
- Investors: 17.53%
- User Airdrop: 11.62%
- DAO Airdrop: 1.13%
III. Market Performance Analysis
Short-term Performance Trends
24-Hour Performance:
- LON: -3.63% (1-hour: +0.19%)
- ARB: -6.72% (1-hour: +0.54%)
7-Day Performance:
- LON: -11.21%
- ARB: -10.91%
30-Day Performance:
- LON: -8.74%
- ARB: -21.8%
12-Month Performance:
- LON: -49.8%
- ARB: -80.73%
Liquidity and Exchange Presence
| Metric | LON | ARB |
|---|---|---|
| 24H Trading Volume | $17,523.95 | $3,871,516.03 |
| Number of Trading Pairs | 2 | 60 |
| Active Holders | 40,074 | 60,163 |
| Market Dominance | 0.0018% | 0.058% |
ARB demonstrates substantially higher trading volume and market infrastructure with 60 active trading pairs compared to LON's 2 pairs, indicating greater market liquidity and exchange accessibility.
IV. Technical Infrastructure
Blockchain Deployment
Tokenlon (LON):
- Contract Address (Ethereum): 0x0000000000095413afc295d19edeb1ad7b71c952
- Blockchain: Ethereum (ERC-20 token)
Arbitrum (ARB):
- Contract Address (Ethereum): 0xb50721bcf8d664c30412cfbc6cf7a15145234ad1
- Contract Address (Arbitrum): 0x912CE59144191C1204E64559FE8253a0e49E6548
- Blockchains: Ethereum and Arbitrum One
V. Market Sentiment Assessment
Current Market Conditions
The cryptocurrency market currently exhibits Extreme Fear sentiment, with the Fear & Greed Index at 17 points. This extreme fear environment is reflected in both tokens' negative price trajectories across multiple timeframes.
Both LON and ARB are experiencing sustained downward pressure, with ARB showing more acute recent deterioration (-6.72% in 24 hours versus LON's -3.63%). The recent achievement of an all-time low by ARB on December 18, 2025 suggests heightened selling pressure in the Layer 2 scaling solution sector.
VI. Key Observations
-
Market Capitalization Differential: ARB maintains a market cap approximately 20.6x larger than LON ($1,045.49M vs $50.82M), reflecting significantly greater market adoption and ecosystem valuation.
-
Liquidity Disparity: ARB's trading volume ($3.87M) substantially exceeds LON's ($17.5K), with ARB trading approximately 221x higher daily volume.
-
Supply Structure: ARB's significantly larger token supply (10B vs 200M max) reflects different tokenomic strategies, with ARB's distribution heavily concentrated in ecosystem treasury (42.78%) versus broader distribution models.
-
Ecosystem Stage: ARB operates as an established Layer 2 infrastructure solution, while LON functions as a specialized decentralized exchange protocol token.
-
Market Environment: Both tokens are experiencing adverse market conditions consistent with the cryptocurrency market's current Extreme Fear sentiment index reading.
Report Date: December 18, 2025
Data Source: Real-time cryptocurrency market data aggregation
Disclaimer: This analysis presents factual market data and does not constitute investment advice or recommendations.
ARB Investment Value Analysis Report
I. Executive Summary
ARB (Arbitrum) derives its primary investment value from its leading position as an Ethereum Layer-2 solution. The token represents a claim on future value accumulation sources, particularly MEV (Maximal Extractable Value) profits and ecosystem growth potential.
Key Value Drivers:
- Dominant Layer-2 market position with superior fundamental metrics
- High transaction throughput and developer ecosystem activity
- Substantial DAO treasury ($2.1 billion+, primarily ETH and ARB denominated)
- Claims on future MEV profit streams from sustained network activity
II. Core Factors Influencing ARB Investment Value
Tokenomics and Supply Mechanism
ARB Token Structure:
- Strategic position as governance and value capture token for Arbitrum ecosystem
- DAO treasury holdings exceed $2.1 billion USD, providing long-term ecosystem funding
- Token distribution aligns incentives between protocol development and stakeholder returns
Value Accrual Mechanism:
- Primary value derives from claim on MEV profits conditional on sustained Arbitrum activity levels
- If current transaction volume levels persist, MEV profit value becomes materially significant
- Token captures value as Arbitrum maintains or expands its Layer-2 market share
Market Adoption and Application Metrics
Network Fundamentals:
- Daily transaction volume: Approximately 900,000 transactions on average
- Transaction throughput comparable to Ethereum mainnet on daily basis
- Total bridge value: Exceeds $1.5 billion USD
- Developer activity level: Leads competing Layer-2 solutions
Ecosystem Development:
- Orbit chain initiative: Allows developers to establish chains with minimal operational overhead
- Market activity concentration: Arbitrum maintains dominant Layer-2 positioning across key metrics (TVL, transaction volume, developer engagement)
Technology Development and Ecosystem Building
Arbitrum's Competitive Advantages:
- Established Layer-2 infrastructure with proven scalability performance
- Orbit chain program enables ecosystem expansion through developer-friendly chain creation
- Sustained developer engagement across DeFi, NFT, and application layer protocols
Ecosystem Maturity:
- Comprehensive DeFi infrastructure operational on Arbitrum
- Active NFT marketplace and gaming protocol integration
- Smart contract functionality supports complex application deployment
Macroeconomic Factors and Market Cycles
Macro Conditions Affecting Crypto Assets:
- Uncertainty in global interest rate environment and monetary policy trajectory affects investor risk appetite
- When macroeconomic policy direction remains unclear, investors typically adopt watchful positioning rather than aggressive accumulation
- Inflation and currency policy shifts influence cross-border transaction demand patterns
Market Sentiment Context:
- ARB performance correlates with broader cryptocurrency market sentiment
- Layer-2 adoption thesis dependent on sustained Ethereum ecosystem value and user migration patterns
III. Value Capture Mechanism Analysis
Primary Value Source: MEV Profit Claims
The fundamental investment thesis centers on ARB token holders' claim on future value accumulation. Specifically:
- Current Activity Baseline: Arbitrum currently sustains high transaction volumes demonstrating genuine network utility
- MEV Value Realization: The magnitude of MEV profit value depends critically on maintaining present activity levels
- Token Value Proposition: ARB primarily represents claim rights on future value sources arising from sustained network adoption
Competitive Positioning
Layer-2 Market Leadership:
- Arbitrum maintains dominant positioning across fundamental metrics compared to competing Layer-2 solutions
- Market activity concentration in TVL, daily transaction count, and developer participation levels
- Sustained leadership position strengthens long-term value sustainability thesis
IV. Key Considerations for Evaluation
Fundamental Strengths
✓ Market-leading Layer-2 transaction throughput and developer ecosystem activity
✓ Substantial treasury resources enabling long-term protocol development and incentive provisioning
✓ Clear value capture mechanism through MEV profit participation
✓ Proven infrastructure supporting DeFi, NFT, and application-layer protocols
Risk Factors
⚠ MEV value realization dependent on sustained activity levels—any material decline in transaction volume directly impacts token fundamental value
⚠ Layer-2 competitive dynamics may intensify; alternative solutions could capture market share
⚠ Macroeconomic policy uncertainty may suppress broader cryptocurrency adoption
⚠ Regulatory developments affecting Ethereum or Layer-2 protocols remain unquantified
V. Conclusion
ARB's investment case rests on three interdependent elements: (1) Arbitrum's demonstrated Layer-2 market leadership across key metrics, (2) the token's direct claim on future MEV profit accumulation, and (3) the ecosystem's capability to sustain current activity levels through developer engagement and application deployment.
The investment value is fundamentally tied to maintaining the network's position as Ethereum's leading scaling solution. Current market activity validates this positioning, but future value realization requires sustained or expanding transaction demand and ecosystem developer participation.
III. 2025-2030 Price Forecast: LON vs ARB
Short-term Forecast (2025)
- LON: Conservative $0.329-$0.411 | Optimistic $0.411-$0.465
- ARB: Conservative $0.152-$0.183 | Optimistic $0.183-$0.238
Medium-term Forecast (2027-2028)
- LON may enter consolidation phase with price recovery potential, estimated range $0.290-$0.740
- ARB may enter growth accumulation phase, estimated range $0.219-$0.291
- Key drivers: Institutional capital inflow, ETF adoption, ecosystem development
Long-term Forecast (2029-2030)
- LON: Base case $0.636-$0.785 | Optimistic scenario $0.903-$0.935
- ARB: Base case $0.284-$0.351 | Optimistic scenario $0.418-$0.513
Disclaimer
This analysis is based on historical data and market models. Cryptocurrency markets are highly volatile and unpredictable. Price forecasts should not be considered as financial advice. Investors should conduct their own research and consult with financial professionals before making investment decisions. Past performance does not guarantee future results.
LON:
| 年份 | 预测最高价 | 预测平均价格 | 预测最低价 | 涨跌幅 |
|---|---|---|---|---|
| 2025 | 0.464882 | 0.4114 | 0.32912 | 0 |
| 2026 | 0.59587176 | 0.438141 | 0.29355447 | 6 |
| 2027 | 0.5480267628 | 0.51700638 | 0.2895235728 | 25 |
| 2028 | 0.740198034246 | 0.5325165714 | 0.447313919976 | 29 |
| 2029 | 0.93544523514981 | 0.636357302823 | 0.52181298831486 | 54 |
| 2030 | 0.903786459334365 | 0.785901268986405 | 0.754465218226948 | 91 |
ARB:
| 年份 | 预测最高价 | 预测平均价格 | 预测最低价 | 涨跌幅 |
|---|---|---|---|---|
| 2025 | 0.23751 | 0.1827 | 0.151641 | 0 |
| 2026 | 0.28784385 | 0.210105 | 0.12816405 | 14 |
| 2027 | 0.30623854275 | 0.248974425 | 0.219097494 | 36 |
| 2028 | 0.29148680806875 | 0.277606483875 | 0.23041338161625 | 51 |
| 2029 | 0.418283569578656 | 0.284546645971875 | 0.239019182616375 | 55 |
| 2030 | 0.513066057351887 | 0.351415107775265 | 0.323301899153244 | 92 |
Comparative Investment Analysis Report: Tokenlon (LON) vs Arbitrum (ARB)
IV. Investment Strategy Comparison: LON vs ARB
Long-term vs Short-term Investment Strategy
Tokenlon (LON):
- Suitable for investors focused on decentralized exchange protocol participation and transaction cost optimization
- Short-term: Speculative positioning given extreme volatility and limited liquidity
- Long-term: Potential value accumulation dependent on ecosystem adoption of decentralized transaction settlement mechanisms
Arbitrum (ARB):
- Suitable for investors seeking exposure to Ethereum scaling infrastructure and Layer-2 ecosystem development
- Short-term: Risk management positioning recommended given -80.73% 12-month performance and current all-time low pricing
- Long-term: Value capture mechanism tied to MEV profit participation and sustained network activity levels
Risk Management and Asset Allocation
Conservative Investor Profile:
- LON: 5-10% allocation (if included; liquidity constraints recommend limiting exposure)
- ARB: 15-25% allocation (Layer-2 infrastructure position with established market presence)
- Recommended allocation: 65-80% to stablecoins and established assets during Extreme Fear market conditions
Aggressive Investor Profile:
- LON: 10-20% allocation (speculative position with potential recovery upside from depressed valuations)
- ARB: 30-45% allocation (Layer-2 leadership position with fundamental value drivers)
- Recommended allocation: 35-60% to stablecoins for dollar-cost averaging during periods of extended decline
Hedging Instruments:
- Stablecoin reserves: 40-50% positioning to capture recovery opportunities during market capitulation
- Diversified Layer-2 exposure: Distribute allocation across multiple scaling solutions to mitigate single-protocol concentration risk
- Cross-asset correlation analysis: Monitor Ethereum mainnet price dynamics as leading indicator for Layer-2 valuation trends
V. Potential Risk Comparison
Market Risk
Tokenlon (LON):
- Extreme liquidity risk: Only 2 active trading pairs creates significant bid-ask spreads and execution slippage for institutional-scale transactions
- Market depth constraint: $17,523.95 daily trading volume insufficient to absorb substantial capital inflows without substantial price appreciation or depreciation
- Concentration risk: 61.89% of total supply in circulation creates potential selling pressure from early investors or large stakeholders
Arbitrum (ARB):
- Intense Layer-2 competitive dynamics: Alternative scaling solutions (Optimism, Polygon) may capture market share through superior economics or developer incentives
- Macro correlation: ARB price performance highly correlated with broader cryptocurrency market sentiment and Ethereum ecosystem valuation
- Valuation compression risk: Current all-time low pricing (December 18, 2025) indicates potential continued downward pressure if market sentiment deteriorates further
Technology Risk
Tokenlon (LON):
- Limited transparency regarding governance module activation timeline and execution framework
- Scalability constraints: ERC-20 deployment limited to Ethereum mainnet without Layer-2 or cross-chain expansion announced
- Smart contract security: No reference materials provided regarding audit status or formal verification methodologies
Arbitrum (ARB):
- Bridge security: Cross-chain value transfer ($1.5 billion+ bridge value) creates systemic risk if bridge infrastructure vulnerabilities emerge
- Sequencer centralization: Arbitrum Rollup operational mode relies on centralized sequencer during current deployment phase, creating potential transaction censorship vectors
- Competing scaling architectures: Technology differentiation from competing Layer-2 solutions (StarkNet's Cairo language, Optimism's collaborative development) may erode Arbitrum's technical advantages
Regulatory Risk
- Decentralized exchange protocol classification: Regulatory treatment of LON governance mechanisms remains uncertain across major jurisdictions
- Layer-2 protocol governance: ARB DAO governance activities may trigger regulatory scrutiny regarding token classification and securities law compliance
- Cross-border settlement implications: Both tokens' transaction settlement functions may become subject to evolving AML/KYC requirements and financial services regulations
- Ethereum ecosystem dependency: Any regulatory actions targeting Ethereum mainnet directly impact both LON and ARB operational viability and valuation sustainability
VI. Conclusion: Which Is the Better Buy?
📌 Investment Value Summary
LON Advantages:
- Specialized decentralized exchange protocol positioning with clear transaction settlement utility
- Significantly lower current valuation (95.8% decline from all-time highs) presents potential asymmetric recovery opportunities
- Governance participation rights provide community stakeholder alignment mechanisms
- Service fee discount utility creates direct value capture for active protocol users
ARB Advantages:
- Market-leading Layer-2 infrastructure position with documented transaction throughput performance (900,000 average daily transactions)
- Substantial DAO treasury ($2.1 billion+) provides long-term ecosystem funding sustainability
- Established developer ecosystem and application deployment infrastructure across DeFi, NFT, and gaming protocols
- 20.6x larger market capitalization ($1,045.49M) with superior liquidity infrastructure (60 trading pairs, $3.87M daily volume)
- Clear MEV profit claim mechanism providing direct value accrual pathway
- Proven institutional adoption and exchange infrastructure integration
✅ Investment Recommendations
For Novice Investors:
- ARB represents the more prudent allocation selection given established market infrastructure, documented utility metrics, and substantially superior liquidity characteristics
- Implement dollar-cost averaging strategy during current Extreme Fear market conditions (Fear & Greed Index: 17)
- Maintain 70%+ stablecoin reserves to capture potential recovery opportunities rather than deploying capital during maximum pessimism
- Avoid LON exposure until liquidity infrastructure substantially improves and trading pair availability expands
For Experienced Investors:
- ARB: Maintain 20-30% portfolio allocation as Layer-2 infrastructure exposure with long-term MEV value accumulation thesis
- LON: Selective accumulation during extreme depressed valuations as potential asymmetric recovery opportunity, limited to 5-15% portfolio allocation given liquidity constraints
- Implement systematic rebalancing at predetermined price levels rather than market-sentiment-driven decision-making
- Monitor Layer-2 competitive dynamics and adjust allocations based on relative transaction volume, developer engagement, and ecosystem funding trends
For Institutional Investors:
- ARB: Establish core infrastructure allocation (2-5% institutional portfolio weighting) capturing Layer-2 scaling trend participation
- Liquidity constraint implications: LON position sizing severely limited by trading infrastructure deficiencies; only institutional investors with dedicated trading infrastructure should consider exposure exceeding $500,000 notional value
- Risk management framework: Implement 50%+ stablecoin reserve positioning to systematically deploy capital during extended market downturns
- Derivative hedging strategy: Consider options-based protection strategies given extreme volatility environment and current Extreme Fear sentiment regime
⚠️ Risk Disclaimer: Cryptocurrency markets exhibit extreme volatility and are subject to rapid, unpredictable price movements. This analysis presents factual market data and comparative framework methodology; it does not constitute investment advice, financial recommendations, or endorsement of either asset. Investors must conduct independent research, evaluate personal risk tolerance, and consult qualified financial professionals before making investment allocation decisions. Historical price performance and forecast models do not guarantee future results. The Extreme Fear market sentiment environment (Fear & Greed Index: 17) indicates heightened volatility and capital loss potential. All investment decisions carry substantial financial risk.
Report Date: December 18, 2025
Data Currency: As of December 18, 2025, 17:09:23 UTC
Analyst Disclosure: This report analyzes publicly available cryptocurrency market data without sponsored positioning or institutional affiliation bias.
None
Frequently Asked Questions: Tokenlon (LON) vs Arbitrum (ARB)
I. FAQ
Q1: What are the key differences between LON and ARB in terms of market position?
A: ARB maintains significantly stronger market positioning with a $1,045.49M market capitalization compared to LON's $50.82M—approximately 20.6 times larger. ARB ranks #80 globally while LON ranks #498. ARB demonstrates substantially superior liquidity with $3.87M daily trading volume across 60 trading pairs, whereas LON shows only $17,523.95 daily volume across 2 trading pairs. ARB operates as an Ethereum Layer-2 scaling solution serving high-throughput infrastructure demands, while LON functions as a specialized decentralized transaction payment and settlement protocol.
Q2: How have LON and ARB performed relative to their historical price peaks?
A: Both tokens have experienced severe depreciation from their respective all-time highs. LON declined 95.8% from its $9.81 peak (January 31, 2021) to the current $0.4106 price level. ARB declined 92.4% from its $2.39 peak (January 12, 2024) to the current $0.1828 price level. Over 12-month performance, LON shows -49.8% deterioration while ARB demonstrates more acute -80.73% decline. ARB recently achieved an all-time low on December 18, 2025, indicating heightened recent selling pressure in the Layer-2 sector.
Q3: Which token offers better investment fundamentals for long-term value accumulation?
A: ARB presents more robust long-term investment fundamentals through its established Layer-2 market leadership, documented MEV (Maximal Extractable Value) profit claim mechanism, substantial DAO treasury ($2.1 billion+), and proven developer ecosystem adoption. ARB sustains approximately 900,000 average daily transactions with bridge value exceeding $1.5 billion USD. LON's investment case depends primarily on ecosystem adoption of its decentralized settlement protocol, with governance rights still pending activation. ARB's infrastructure positioning provides clearer value capture mechanisms compared to LON's specialized protocol focus.
Q4: What are the critical risk factors distinguishing these two assets?
A: LON faces extreme liquidity risk with only 2 trading pairs and $17,523.95 daily volume, creating substantial execution slippage for institutional-scale transactions. LON governance module activation timeline remains unannounced, introducing implementation uncertainty. ARB confronts intense Layer-2 competitive dynamics from alternative solutions (Optimism, Polygon), sequencer centralization risks, and regulatory classification uncertainty regarding DAO governance activities. Both tokens face macro correlation with broader cryptocurrency market sentiment, though ARB's larger scale reduces single-asset concentration risk relative to LON's illiquid infrastructure.
Q5: How should different investor profiles allocate capital between LON and ARB during current market conditions?
A: Conservative investors should emphasize ARB allocation (15-25% if including Layer-2 exposure) with 65-80% stablecoin reserves given Extreme Fear market sentiment (Fear & Greed Index: 17). LON inclusion should not exceed 5-10% maximum due to liquidity constraints. Aggressive investors can increase ARB positioning to 30-45% with 35-60% stablecoin reserves for dollar-cost averaging opportunities. Institutional investors should restrict LON positions to small allocations only with dedicated trading infrastructure due to illiquidity limitations. Experienced investors should implement systematic rebalancing strategies rather than market-sentiment-driven positioning during extreme volatility periods.
Q6: What does the price forecast suggest for 2025-2030 investment horizons?
A: Conservative 2025 projections estimate LON range $0.329-$0.411 and ARB range $0.152-$0.183. By 2028, LON forecasts suggest $0.290-$0.740 range with ARB at $0.219-$0.291. Long-term 2029-2030 base case scenarios project LON at $0.636-$0.785 and ARB at $0.284-$0.351, with optimistic scenarios extending to LON $0.903-$0.935 and ARB $0.418-$0.513. These forecasts depend critically on sustained ecosystem adoption, macroeconomic policy normalization, and absence of adverse regulatory developments. Actual performance may diverge substantially from projections given cryptocurrency market volatility and unpredictability.
Q7: Which token presents superior asymmetric risk-reward opportunities for different investment timeframes?
A: ARB offers superior risk-adjusted positioning for medium-to-long-term investment horizons (2+ years) through established infrastructure, documented utility metrics, and clear value accumulation mechanisms. LON presents potential asymmetric recovery opportunities for contrarian investors with 5-15% portfolio allocations due to extreme depressed valuations (95.8% from all-time highs), though liquidity infrastructure constraints severely limit institutional access. Short-term speculative positioning in either asset carries substantial capital loss risk during current Extreme Fear sentiment regime. Dollar-cost averaging strategies with extended timeframes reduce timing risk compared to lump-sum capital deployment during maximum pessimism.
Q8: How do token supply mechanics and governance structures differentiate long-term value capture potential?
A: ARB maintains 57.19% circulating supply from 10B total tokens with substantial DAO treasury allocation (42.78%), enabling long-term ecosystem incentive provisioning and protocol development funding. LON shows 61.89% circulating supply from 200M maximum tokens with pending governance module activation, creating implementation timeline uncertainty. ARB's MEV profit claim mechanism provides direct value capture pathway conditional on sustained transaction activity levels. LON's value capture depends on transaction fee discount mechanisms and governance participation rights, with unclear activation status reducing near-term value realization certainty. ARB's larger token supply structure reflects different tokenomic strategies with DAO treasury concentration versus broader early-participant distribution models.
Share
Content
Introduction: LON vs ARB Investment Comparison
I. Historical Price Comparison and Current Market Status
II. Project Overview and Utility
III. Market Performance Analysis
IV. Technical Infrastructure
V. Market Sentiment Assessment
VI. Key Observations
I. Executive Summary
II. Core Factors Influencing ARB Investment Value
III. Value Capture Mechanism Analysis
IV. Key Considerations for Evaluation
V. Conclusion
III. 2025-2030 Price Forecast: LON vs ARB
IV. Investment Strategy Comparison: LON vs ARB
V. Potential Risk Comparison
VI. Conclusion: Which Is the Better Buy?
I. FAQ
How to Buy Cryptocurrency


Trending Cryptocurrencies


What is AVAX: A Comprehensive Guide to Avalanche's Native Cryptocurrency

What is VELODROME: The Revolutionary Cycling Track Transforming Professional Racing and Urban Recreation

2025 POL Price Prediction: Analyzing Market Trends and Potential Growth Factors
2025 MNT Price Prediction: Analyzing Market Trends and Potential Growth Factors

How Does Cronos (CRO) Token Economic Model Work in 2025?

How Active is the Synthetix (SNX) Community and Ecosystem in 2025?

How to Connect the Polygon Network to Your Digital Wallet

BOME vs SNX: A Comprehensive Comparison of Two Leading DeFi Tokens in 2024
ACH vs LRC: A Comprehensive Comparison of Two Leading Layer-2 Scaling Solutions
Guide: Integrating Arbitrum Network with Your MetaMask Wallet

Discover the Leading NFT Projects for 2024