SFUND vs DOT: Comparing Investment Opportunities in the Blockchain Ecosystem


Introduction: Investment Comparison between SFUND and DOT
In the cryptocurrency market, the comparison between Seedify.fund (SFUND) vs Polkadot (DOT) has been an unavoidable topic for investors. The two not only show significant differences in market cap ranking, application scenarios, and price performance, but also represent different positioning in crypto assets.
Seedify.fund (SFUND): Since its launch in 2021, it has gained market recognition as an incubator and seed fund supporting blockchain ecosystem innovation.
Polkadot (DOT): Introduced in 2020, it has been hailed as a next-generation blockchain protocol, aiming to enable interoperability between diverse blockchains.
This article will provide a comprehensive analysis of the investment value comparison between SFUND and DOT, focusing on historical price trends, supply mechanisms, institutional adoption, technological ecosystems, and future predictions, attempting to answer the question most concerning to investors:
"Which is the better buy right now?"
I. Price History Comparison and Current Market Status
SFUND (Coin A) and DOT (Coin B) Historical Price Trends
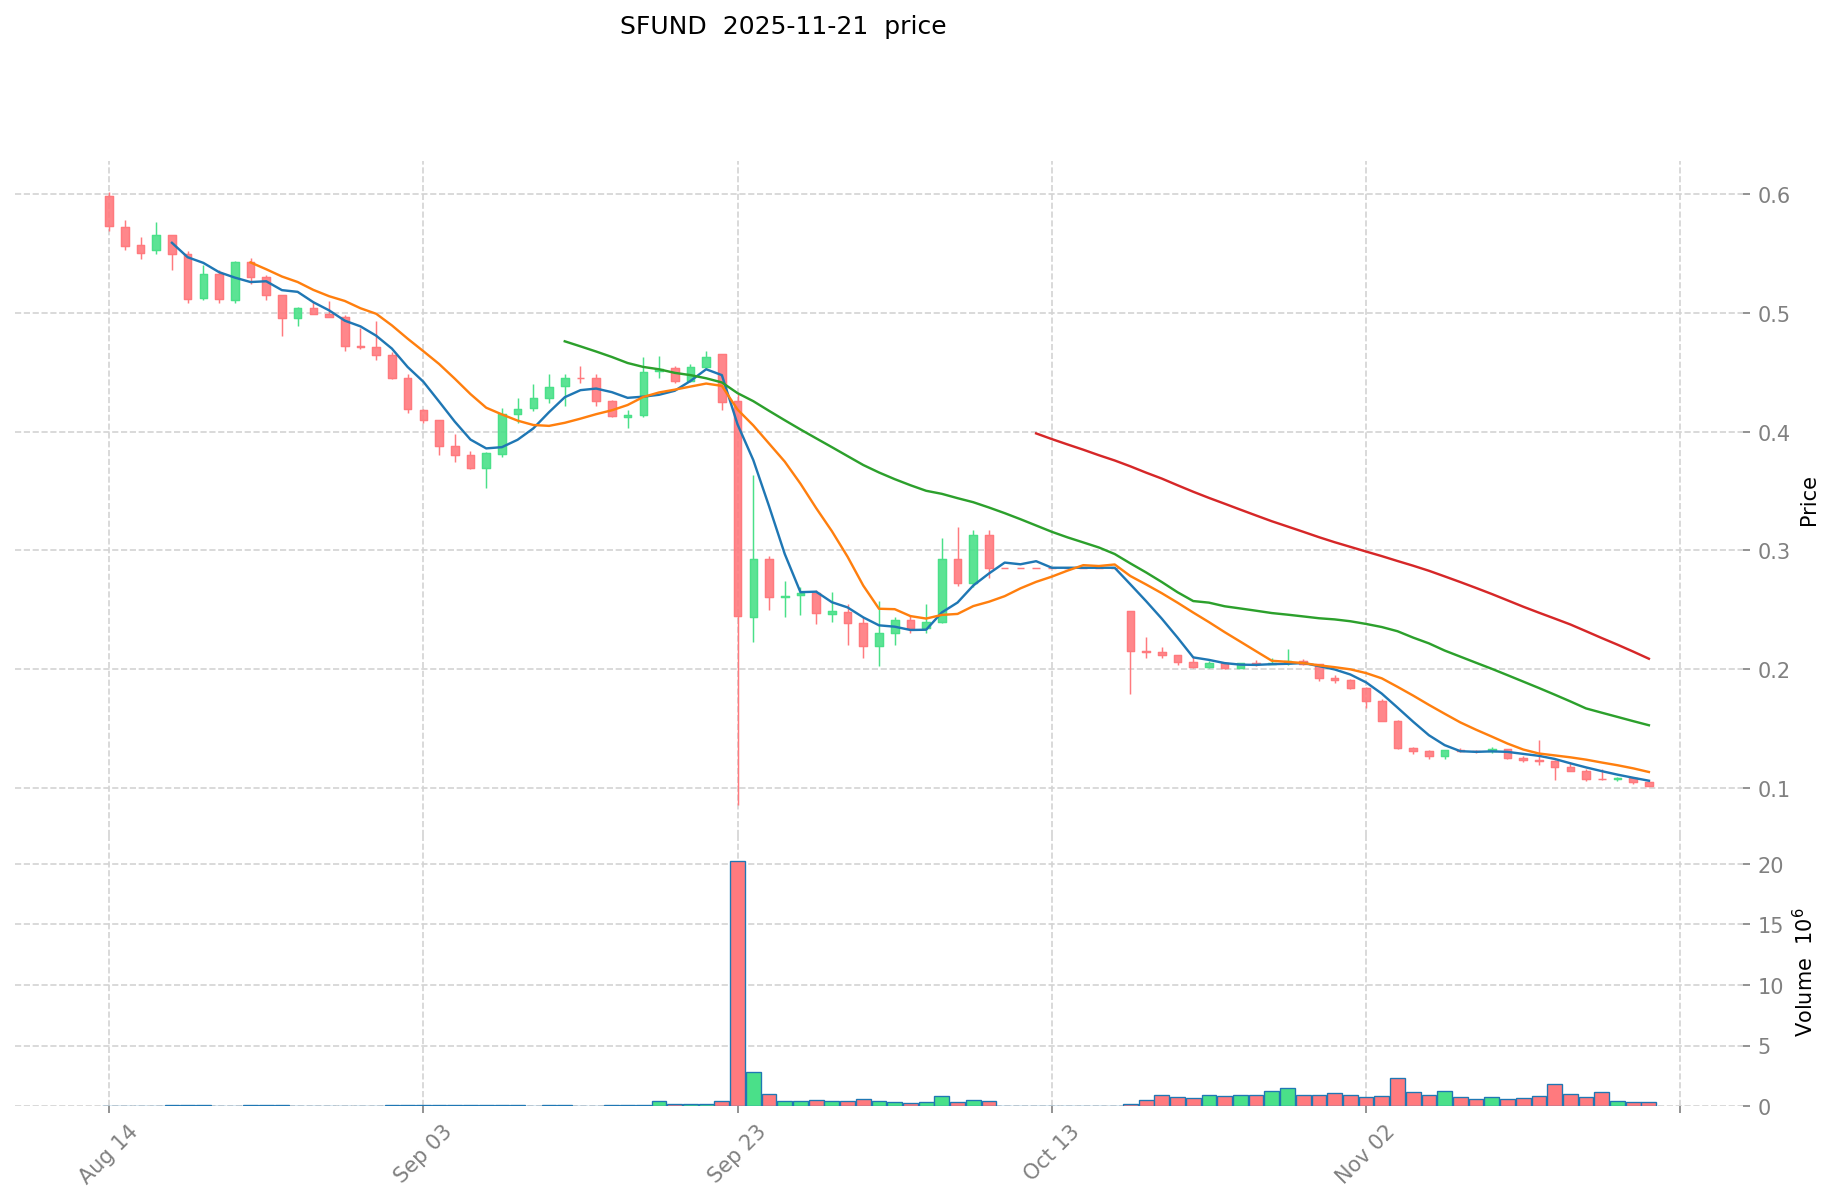
- 2021: SFUND reached its all-time high of $16.79 on November 29, 2021.
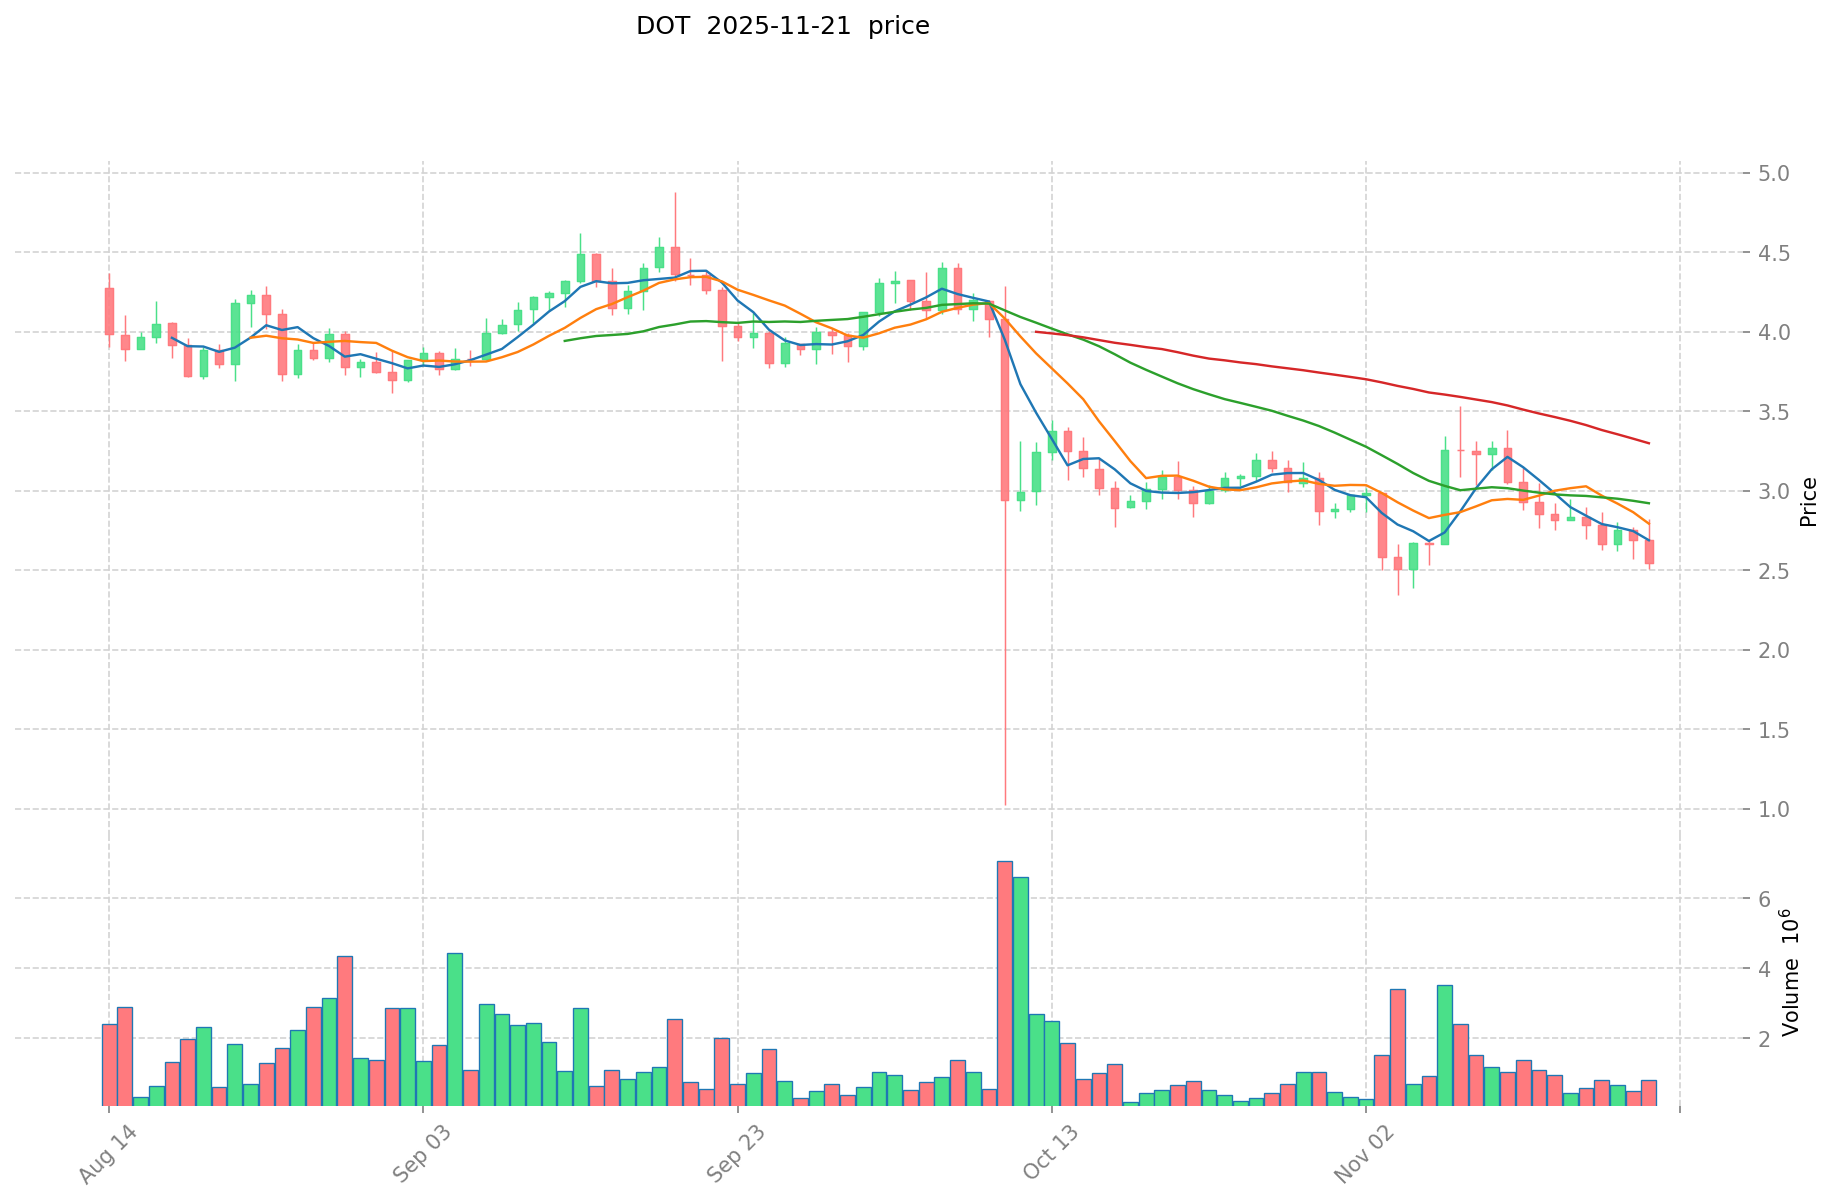
- 2021: DOT hit its all-time high of $54.98 on November 4, 2021.
- Comparative analysis: During the market cycle, SFUND dropped from its peak of $16.79 to a low of $0.053711, while DOT declined from $54.98 to $2.13.
Current Market Situation (2025-11-22)
- SFUND current price: $0.0938
- DOT current price: $2.434
- 24-hour trading volume: SFUND $38,602.03 vs DOT $3,595,530.66
- Market Sentiment Index (Fear & Greed Index): 14 (Extreme Fear)
Click to view real-time prices:
- Check SFUND current price Market Price
- Check DOT current price Market Price
II. Core Factors Affecting Investment Value of SFUND vs DOT
Supply Mechanism Comparison (Tokenomics)
- SFUND: Fixed supply of 10 billion tokens with deflationary mechanism through token burning
- DOT: Inflationary model with approximately 10% annual inflation, adjusted through governance
- 📌 Historical Pattern: Deflationary tokens like SFUND tend to create upward price pressure during bull markets, while DOT's inflation requires continuous ecosystem growth to offset dilution effects.
Institutional Adoption and Market Applications
- Institutional Holdings: DOT has gained more institutional traction with Coinbase Custody, Grayscale's Digital Large Cap Fund, and various crypto hedge funds including it in portfolios
- Enterprise Adoption: DOT has stronger enterprise connections through Polkadot's Web3 Foundation partnerships with companies developing cross-chain solutions, while SFUD focuses more on gaming and NFT ecosystems
- Regulatory Stance: Both tokens face similar regulatory scrutiny, though DOT's broader ecosystem and more established presence may provide better regulatory clarity in major jurisdictions
Technical Development and Ecosystem Building
- SFUND Technical Upgrades: Focusing on gaming launchpad improvements, NFT marketplace integration, and cross-chain functionality for gaming assets
- DOT Technical Development: Continuous parachain auctions, cross-consensus messaging (XCM) protocols, and substrate framework improvements enhancing interoperability
- Ecosystem Comparison: DOT has a more diverse ecosystem spanning DeFi, cross-chain bridges, and enterprise solutions, while SFUND is more concentrated in GameFi, metaverse applications, and NFT marketplaces
Macroeconomic Factors and Market Cycles
- Inflation Performance: DOT's governance-adjustable inflation model allows adaptation to market conditions, while SFUND's fixed supply may theoretically provide better store of value during high inflation periods
- Monetary Policy Impact: Both assets show correlation with risk assets during interest rate changes, with DOT historically displaying higher volatility
- Geopolitical Factors: DOT's cross-chain infrastructure positioning makes it potentially more valuable in fragmented regulatory environments, while SFUND's gaming focus may be less affected by cross-border restrictions
III. 2025-2030 Price Prediction: SFUND vs DOT
Short-term Prediction (2025)
- SFUND: Conservative $0.06566 - $0.0938 | Optimistic $0.0938 - $0.104118
- DOT: Conservative $1.96344 - $2.424 | Optimistic $2.424 - $2.7876
Mid-term Prediction (2027)
- SFUND may enter a growth phase, with estimated price range $0.0683113977 - $0.1701995841
- DOT may enter a steady growth phase, with estimated price range $1.6781352 - $3.7758042
- Key drivers: Institutional capital inflow, ETF, ecosystem development
Long-term Prediction (2030)
- SFUND: Base scenario $0.17399121401844 - $0.248807436046369 | Optimistic scenario $0.248807436046369+
- DOT: Base scenario $4.533324917625 - $6.346654884675 | Optimistic scenario $6.346654884675+
Disclaimer: This analysis is based on historical data and market projections. Cryptocurrency markets are highly volatile and unpredictable. This information should not be considered as financial advice. Always conduct your own research before making investment decisions.
SFUND:
| 年份 | 预测最高价 | 预测平均价格 | 预测最低价 | 涨跌幅 |
|---|---|---|---|---|
| 2025 | 0.104118 | 0.0938 | 0.06566 | 0 |
| 2026 | 0.13260506 | 0.098959 | 0.06234417 | 5 |
| 2027 | 0.1701995841 | 0.11578203 | 0.0683113977 | 23 |
| 2028 | 0.154430071614 | 0.14299080705 | 0.111532829499 | 52 |
| 2029 | 0.19927198870488 | 0.148710439332 | 0.09368757677916 | 58 |
| 2030 | 0.248807436046369 | 0.17399121401844 | 0.111354376971801 | 85 |
DOT:
| 年份 | 预测最高价 | 预测平均价格 | 预测最低价 | 涨跌幅 |
|---|---|---|---|---|
| 2025 | 2.7876 | 2.424 | 1.96344 | 0 |
| 2026 | 3.38754 | 2.6058 | 1.771944 | 7 |
| 2027 | 3.7758042 | 2.99667 | 1.6781352 | 23 |
| 2028 | 4.673007198 | 3.3862371 | 2.946026277 | 39 |
| 2029 | 5.03702768625 | 4.029622149 | 3.86843726304 | 65 |
| 2030 | 6.346654884675 | 4.533324917625 | 3.03732769480875 | 86 |
IV. Investment Strategy Comparison: SFUND vs DOT
Long-term vs Short-term Investment Strategies
- SFUND: Suitable for investors focused on GameFi, NFT ecosystems, and early-stage blockchain projects
- DOT: Suitable for investors seeking interoperability solutions and broader blockchain ecosystem exposure
Risk Management and Asset Allocation
- Conservative investors: SFUND: 20% vs DOT: 80%
- Aggressive investors: SFUND: 40% vs DOT: 60%
- Hedging tools: Stablecoin allocation, options, cross-currency portfolios
V. Potential Risk Comparison
Market Risks
- SFUND: Higher volatility due to smaller market cap and niche focus
- DOT: Susceptible to broader crypto market trends and competition from other interoperability solutions
Technical Risks
- SFUND: Scalability issues, platform stability
- DOT: Parachain auction complexities, cross-chain security vulnerabilities
Regulatory Risks
- Global regulatory policies may impact DOT more due to its wider ecosystem and institutional adoption, while SFUND may face scrutiny in gaming-related regulations
VI. Conclusion: Which Is the Better Buy?
📌 Investment Value Summary:
- SFUND advantages: Focused ecosystem in gaming and NFTs, potential for high growth in niche markets
- DOT advantages: Established interoperability platform, broader ecosystem, stronger institutional backing
✅ Investment Advice:
- New investors: Consider a smaller allocation to SFUND for exposure to gaming and NFT trends, with a larger position in DOT for more established ecosystem exposure
- Experienced investors: Balance between SFUND and DOT based on risk tolerance and belief in specific blockchain sectors
- Institutional investors: Focus on DOT for its broader ecosystem and established presence, while considering SFUND for diversification into gaming and NFT sectors
⚠️ Risk Warning: The cryptocurrency market is highly volatile. This article does not constitute investment advice. None
VII. FAQ
Q1: What are the main differences between SFUND and DOT? A: SFUND is focused on gaming and NFT ecosystems, while DOT is a broader interoperability platform. SFUND has a fixed supply with a deflationary mechanism, whereas DOT has an inflationary model. DOT has gained more institutional adoption and has a more diverse ecosystem.
Q2: Which token has performed better historically? A: Both tokens reached their all-time highs in November 2021. SFUND peaked at $16.79, while DOT reached $54.98. However, both have since declined significantly, with SFUND currently at $0.0938 and DOT at $2.434 as of 2025-11-22.
Q3: How do their supply mechanisms differ? A: SFUND has a fixed supply of 10 billion tokens with a deflationary mechanism through token burning. DOT has an inflationary model with approximately 10% annual inflation, which can be adjusted through governance.
Q4: Which token is considered more suitable for long-term investment? A: DOT is generally considered more suitable for long-term investment due to its broader ecosystem, stronger institutional backing, and established presence in the interoperability sector. However, SFUND may offer higher growth potential in niche markets like gaming and NFTs.
Q5: What are the key risk factors for each token? A: For SFUND, key risks include higher volatility due to smaller market cap, scalability issues, and platform stability. For DOT, risks involve susceptibility to broader crypto market trends, competition from other interoperability solutions, and complexities in parachain auctions and cross-chain security.
Q6: How do their future price predictions compare? A: By 2030, SFUND's base scenario predicts a range of $0.17399121401844 - $0.248807436046369, while DOT's base scenario predicts $4.533324917625 - $6.346654884675. Both have potential for higher prices in optimistic scenarios.
Q7: What allocation strategy is recommended for investors? A: Conservative investors might consider allocating 20% to SFUND and 80% to DOT, while more aggressive investors could opt for 40% SFUND and 60% DOT. New investors are advised to have a larger position in DOT for established ecosystem exposure, with a smaller allocation to SFUND for gaming and NFT trend exposure.
Share
Content
Introduction: Investment Comparison between SFUND and DOT
I. Price History Comparison and Current Market Status
II. Core Factors Affecting Investment Value of SFUND vs DOT
III. 2025-2030 Price Prediction: SFUND vs DOT
IV. Investment Strategy Comparison: SFUND vs DOT
V. Potential Risk Comparison
VI. Conclusion: Which Is the Better Buy?
VII. FAQ
How to Buy Cryptocurrency


Trending Cryptocurrencies


LIKE vs FLOW: Unleashing the Power of Authentic Engagement in Social Media Marketing

Is Metan Chain (METAN) a good investment?: Analyzing the potential and risks of this emerging cryptocurrency
Is Babylons (BABI) a good investment?: Analyzing the Potential and Risks of this Emerging Crypto Asset

Is Flow (FLOW) a good investment?: Analyzing the potential and risks of this blockchain platform for smart contracts
FEAR vs DOT: Navigating Emotional and Rational Decision-Making in Uncertain Times

2025 GAMESTARTER Price Prediction: Analyzing Market Trends and Growth Potential for the Gaming Token

What is PIEVERSE token economics model with 1 billion supply breakdown?

How Is PIEVERSE Community Activity and Ecosystem Engagement Driving Its Token Value?

A Beginner's Guide to Risk Management in Online Trading

What is Official Trump (TRUMP) market overview: price, market cap, and 24-hour trading volume?
Bitcoin Dips Under 115,000 USD: Long-Term Bull Market Prospects