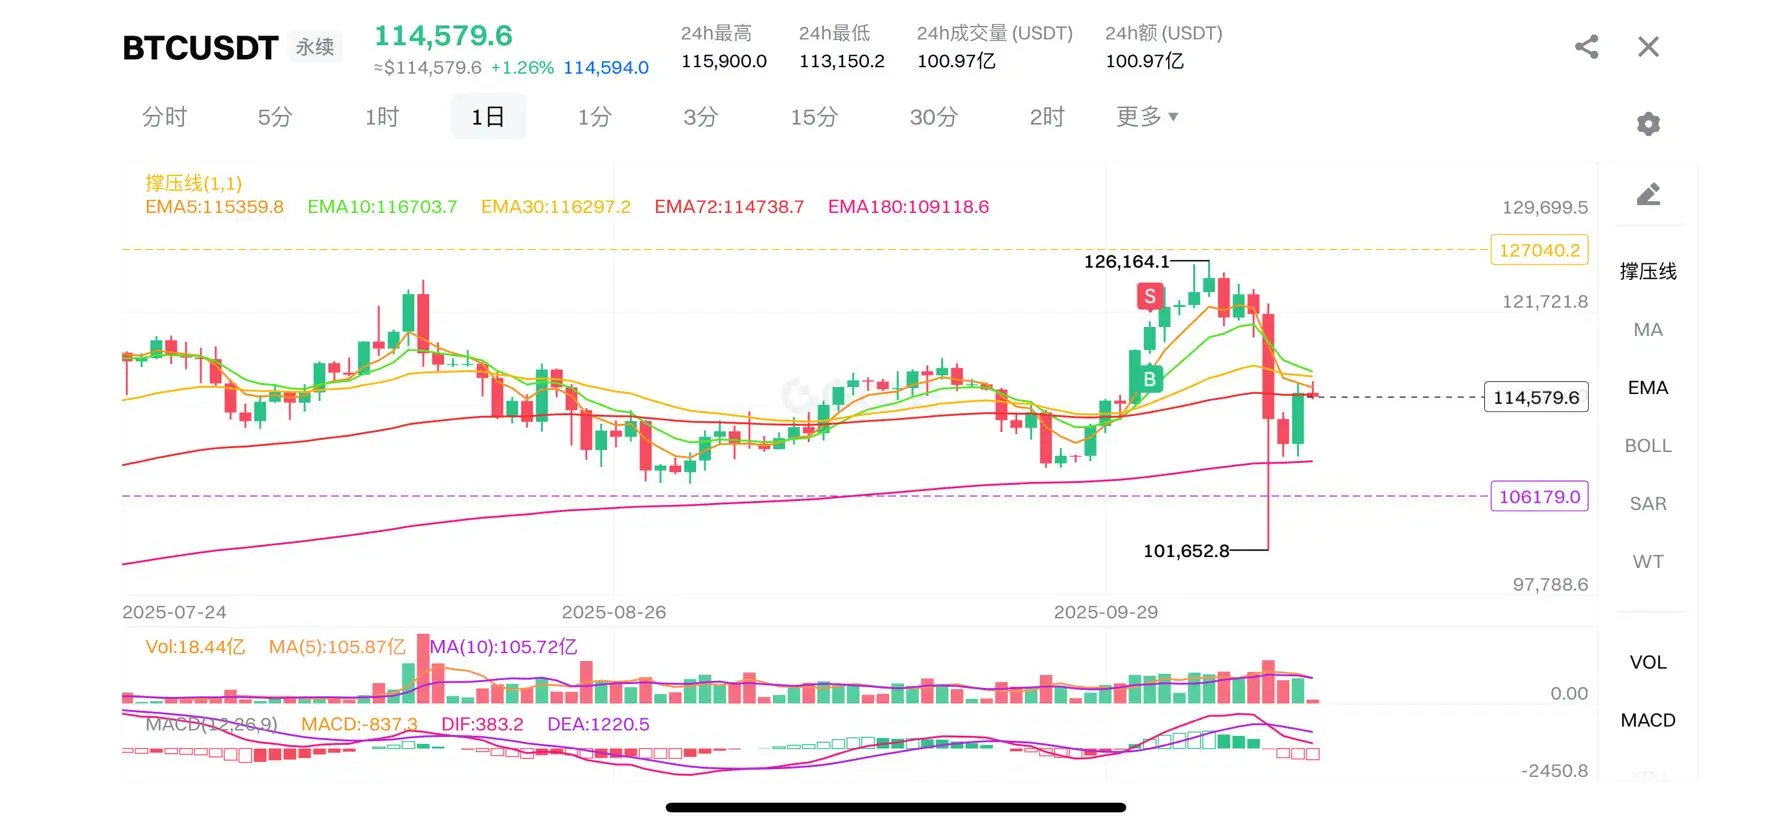
BTC Market Analysis on October 14
#加密市场反弹 1. Trend Analysis
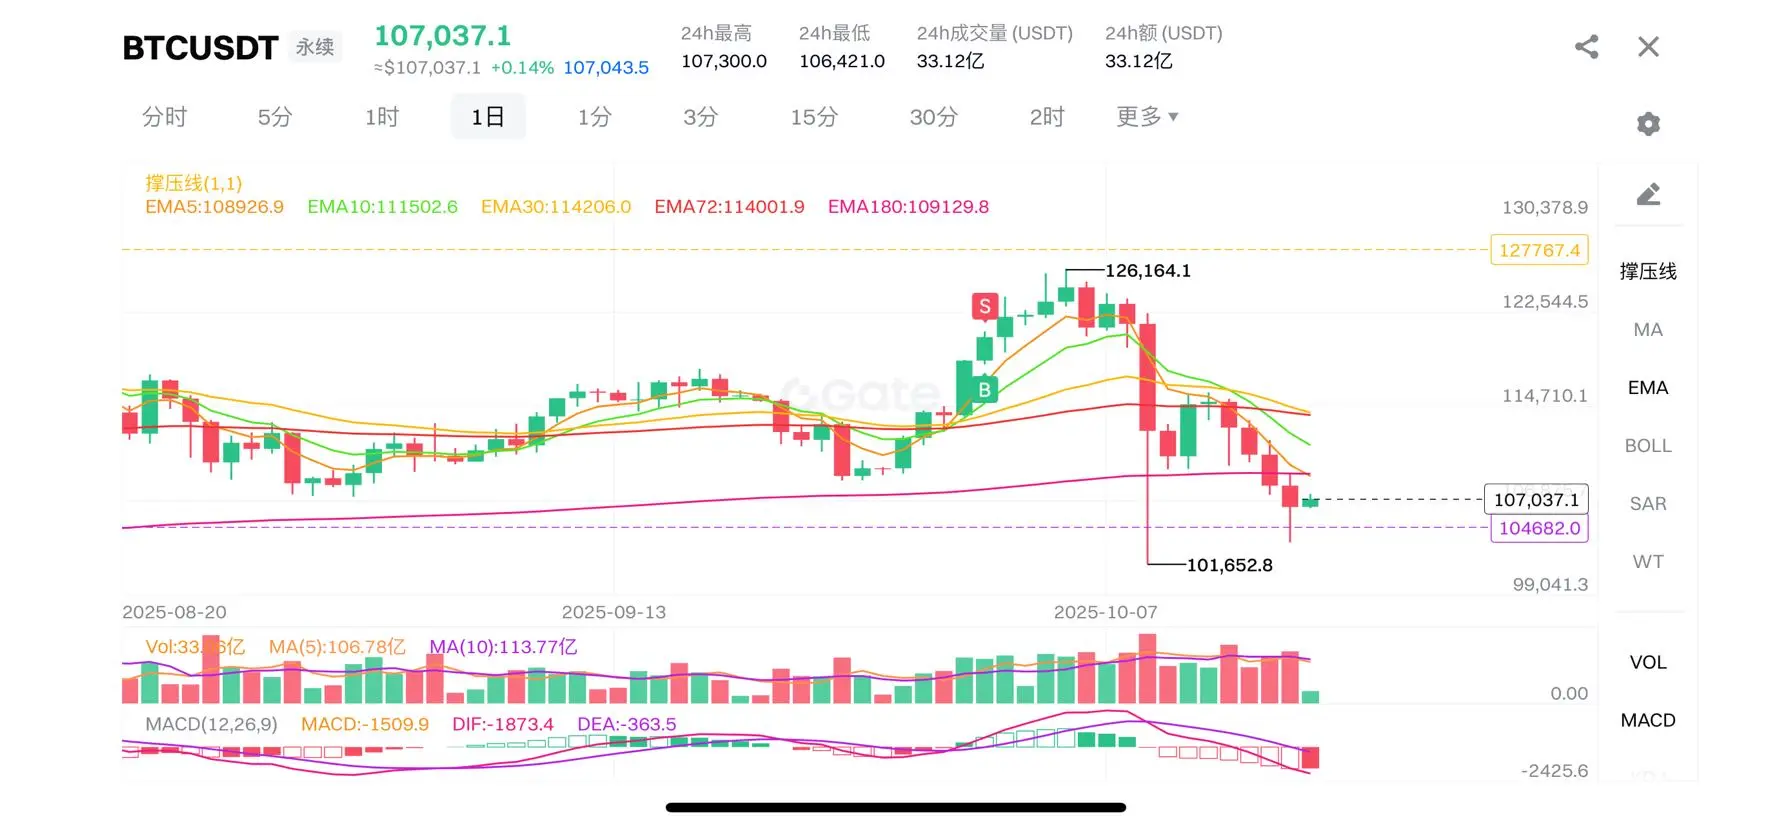
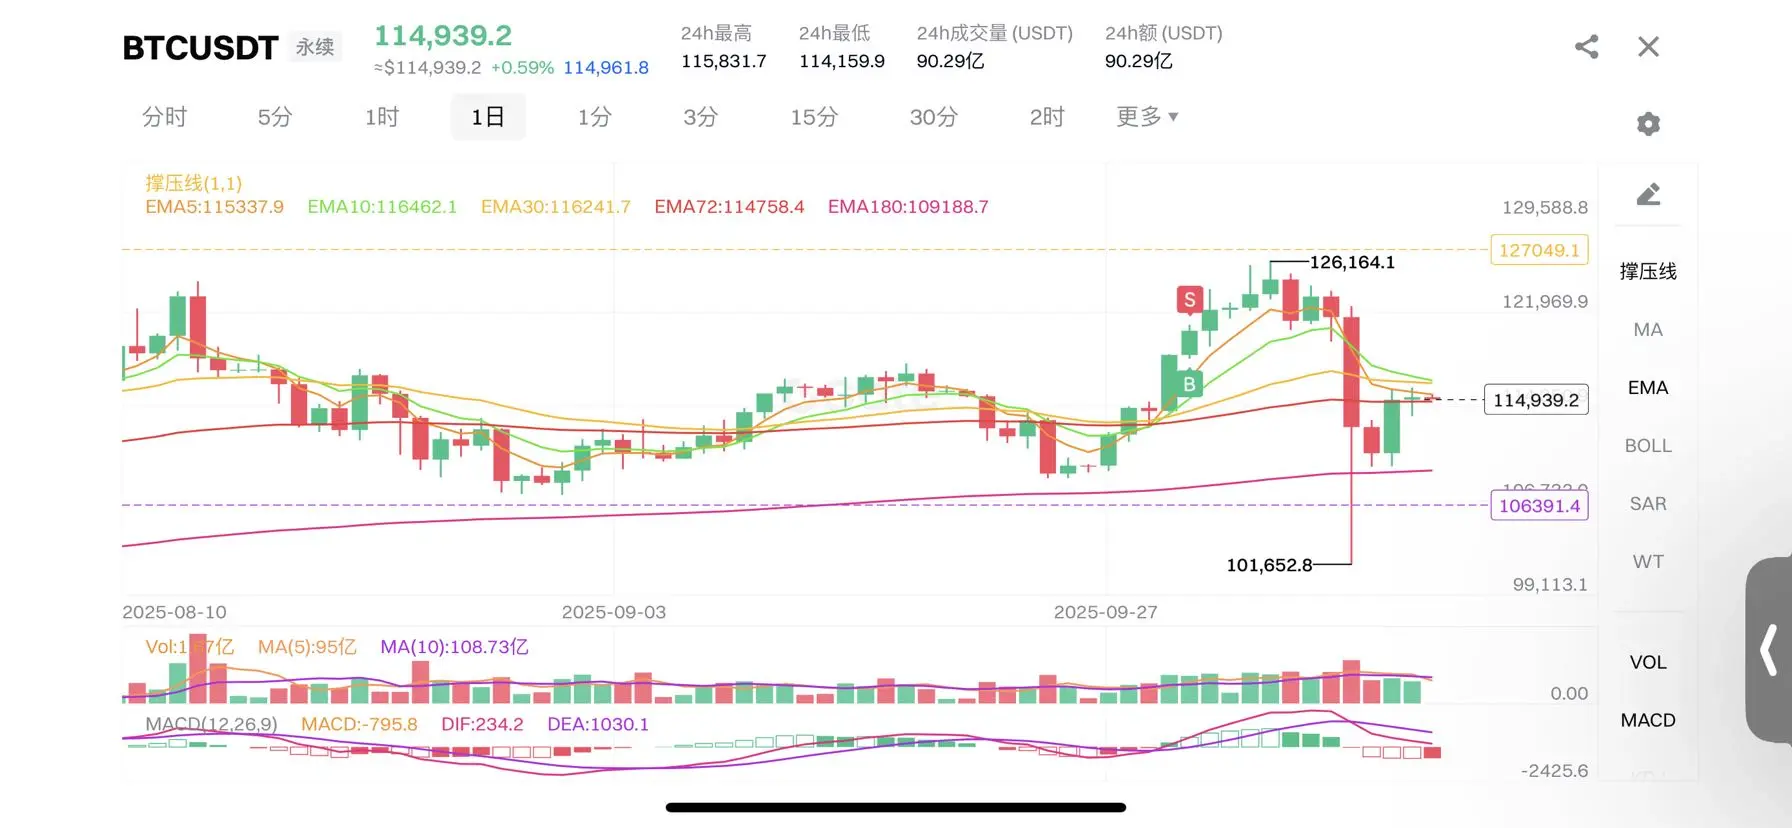
· Short-term bearish pressure is evident: the price is below EMA5, EMA10, and EMA30, indicating a weak short-term trend.
· Key support test: The current price of 114,939.2 is slightly above the EMA72 at 114,758.4, oscillating above this important medium-term support.
· Moving Average Arrangement: EMA5 < EMA10 < EMA30, the short-term moving averages are in a bearish arrangement.
· The long-term trend remains: the price is still far above EMA180(109,188.7), and the long-term bull market pattern has not been broken.
2. Price Position An