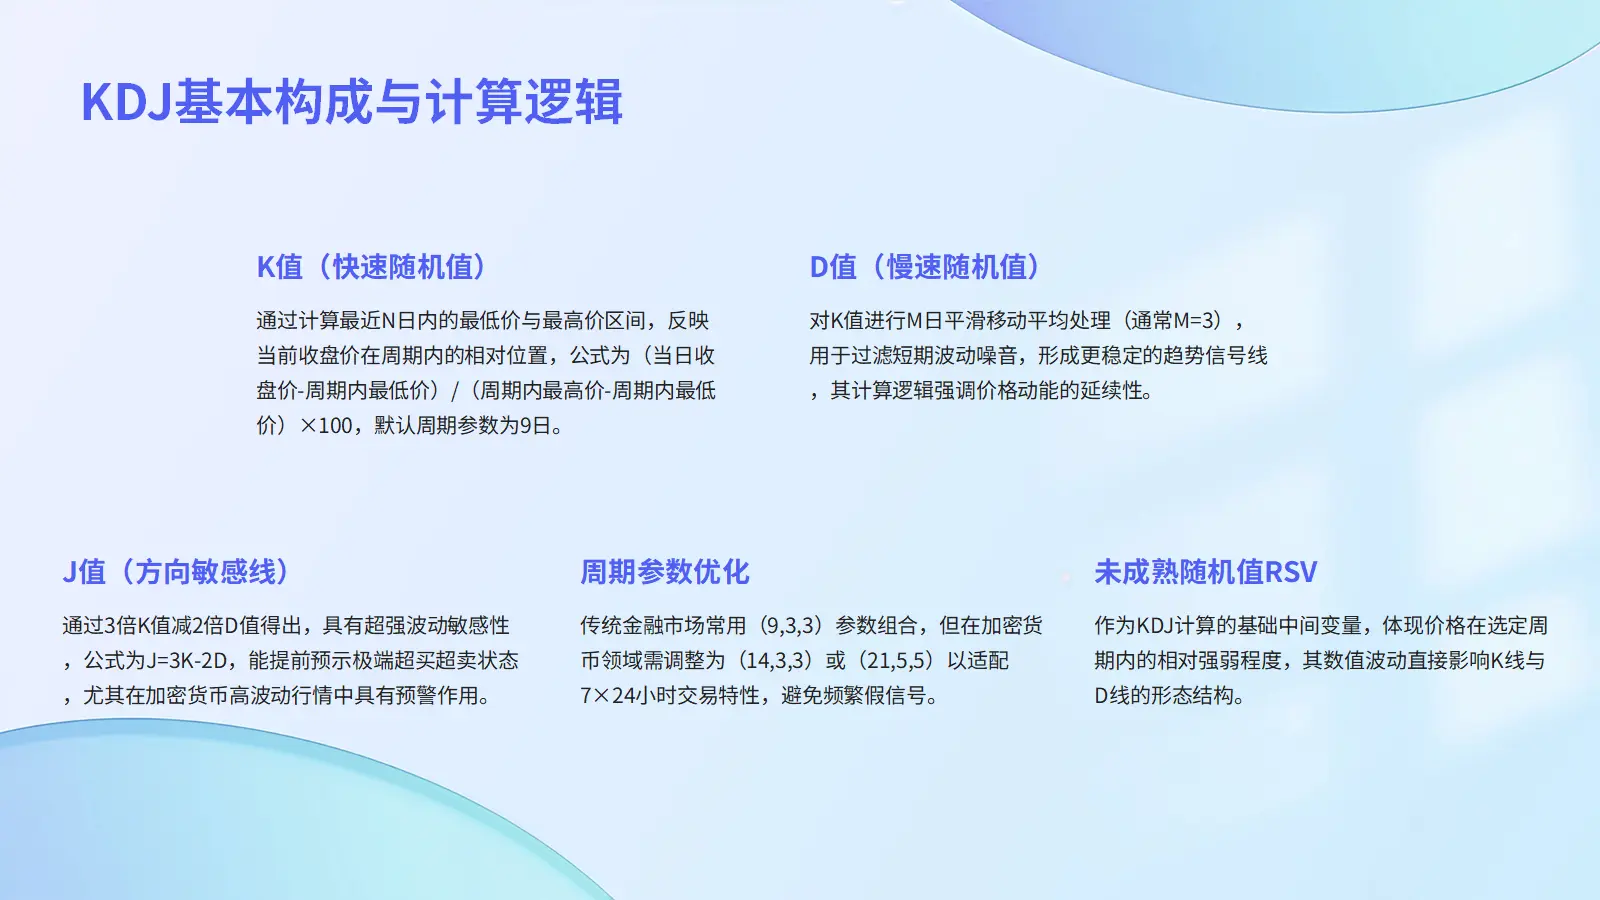
KDJ is one of the most commonly used indicators in Technical Analysis. It combines the advantages of momentum, relative strength, and moving averages. During the calculation process, it mainly studies the relationship between the highest price, lowest price, and Closing Price, reflecting the relative strength of price movement and the Overbought and Oversold conditions.
General Principles:
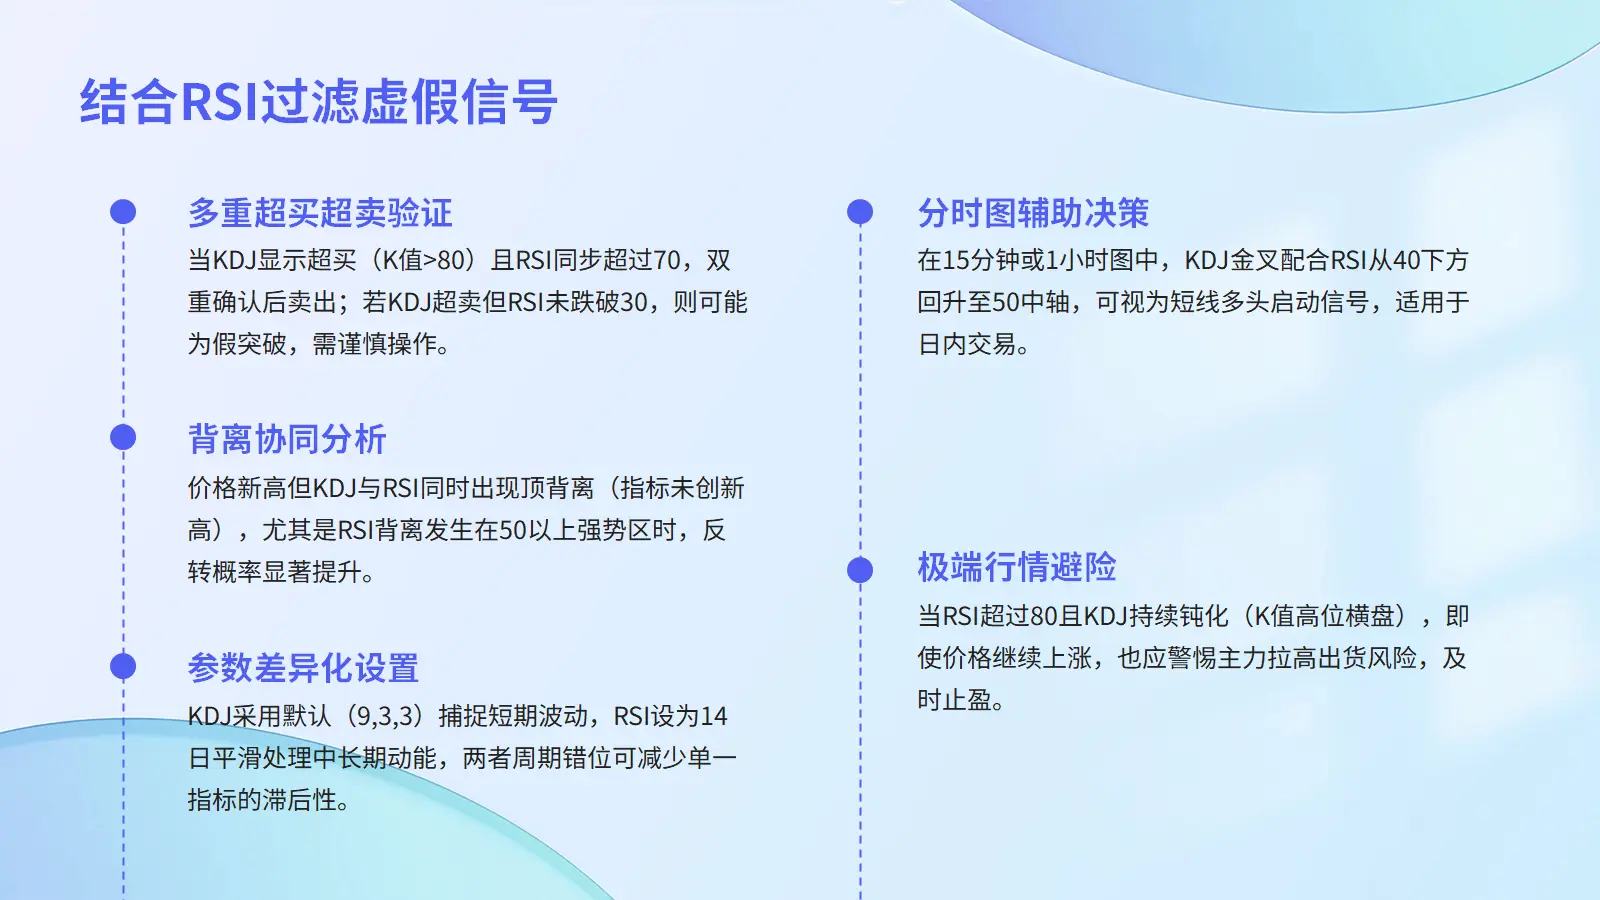
1. D%>80, market Overbought; D%<20, market Oversold.
2. J%>100, market Overbought; J%<10, market Oversold.
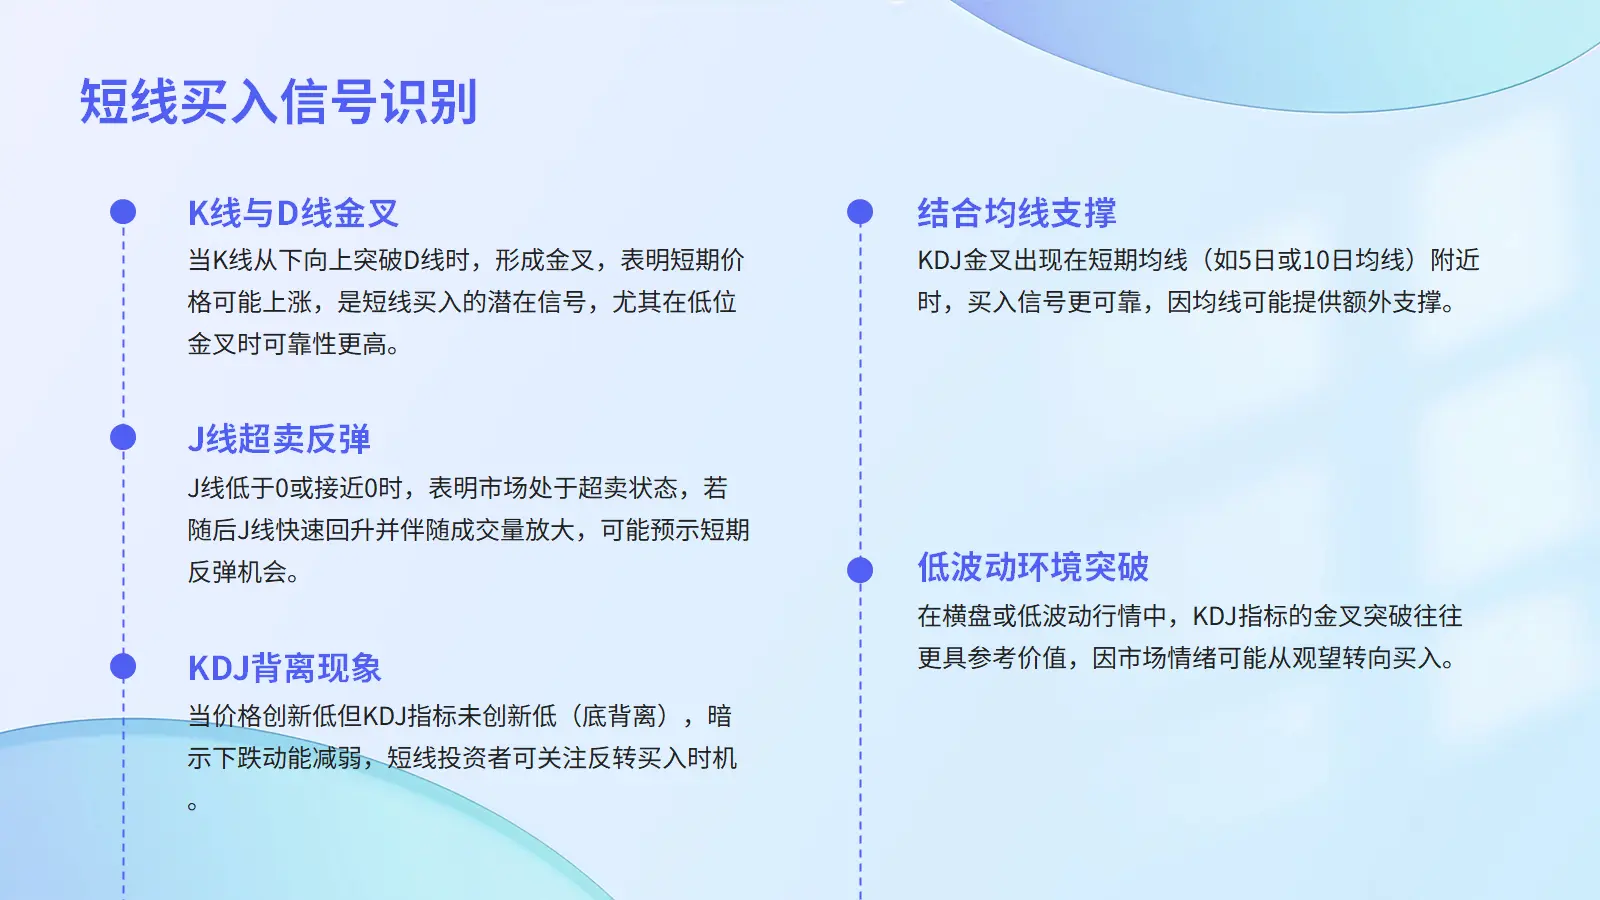
3. KD Golden Cross: K% crosses above D%, is a buy signal.
4. KD Death Cross: K% breaks below D%, ind
View Original