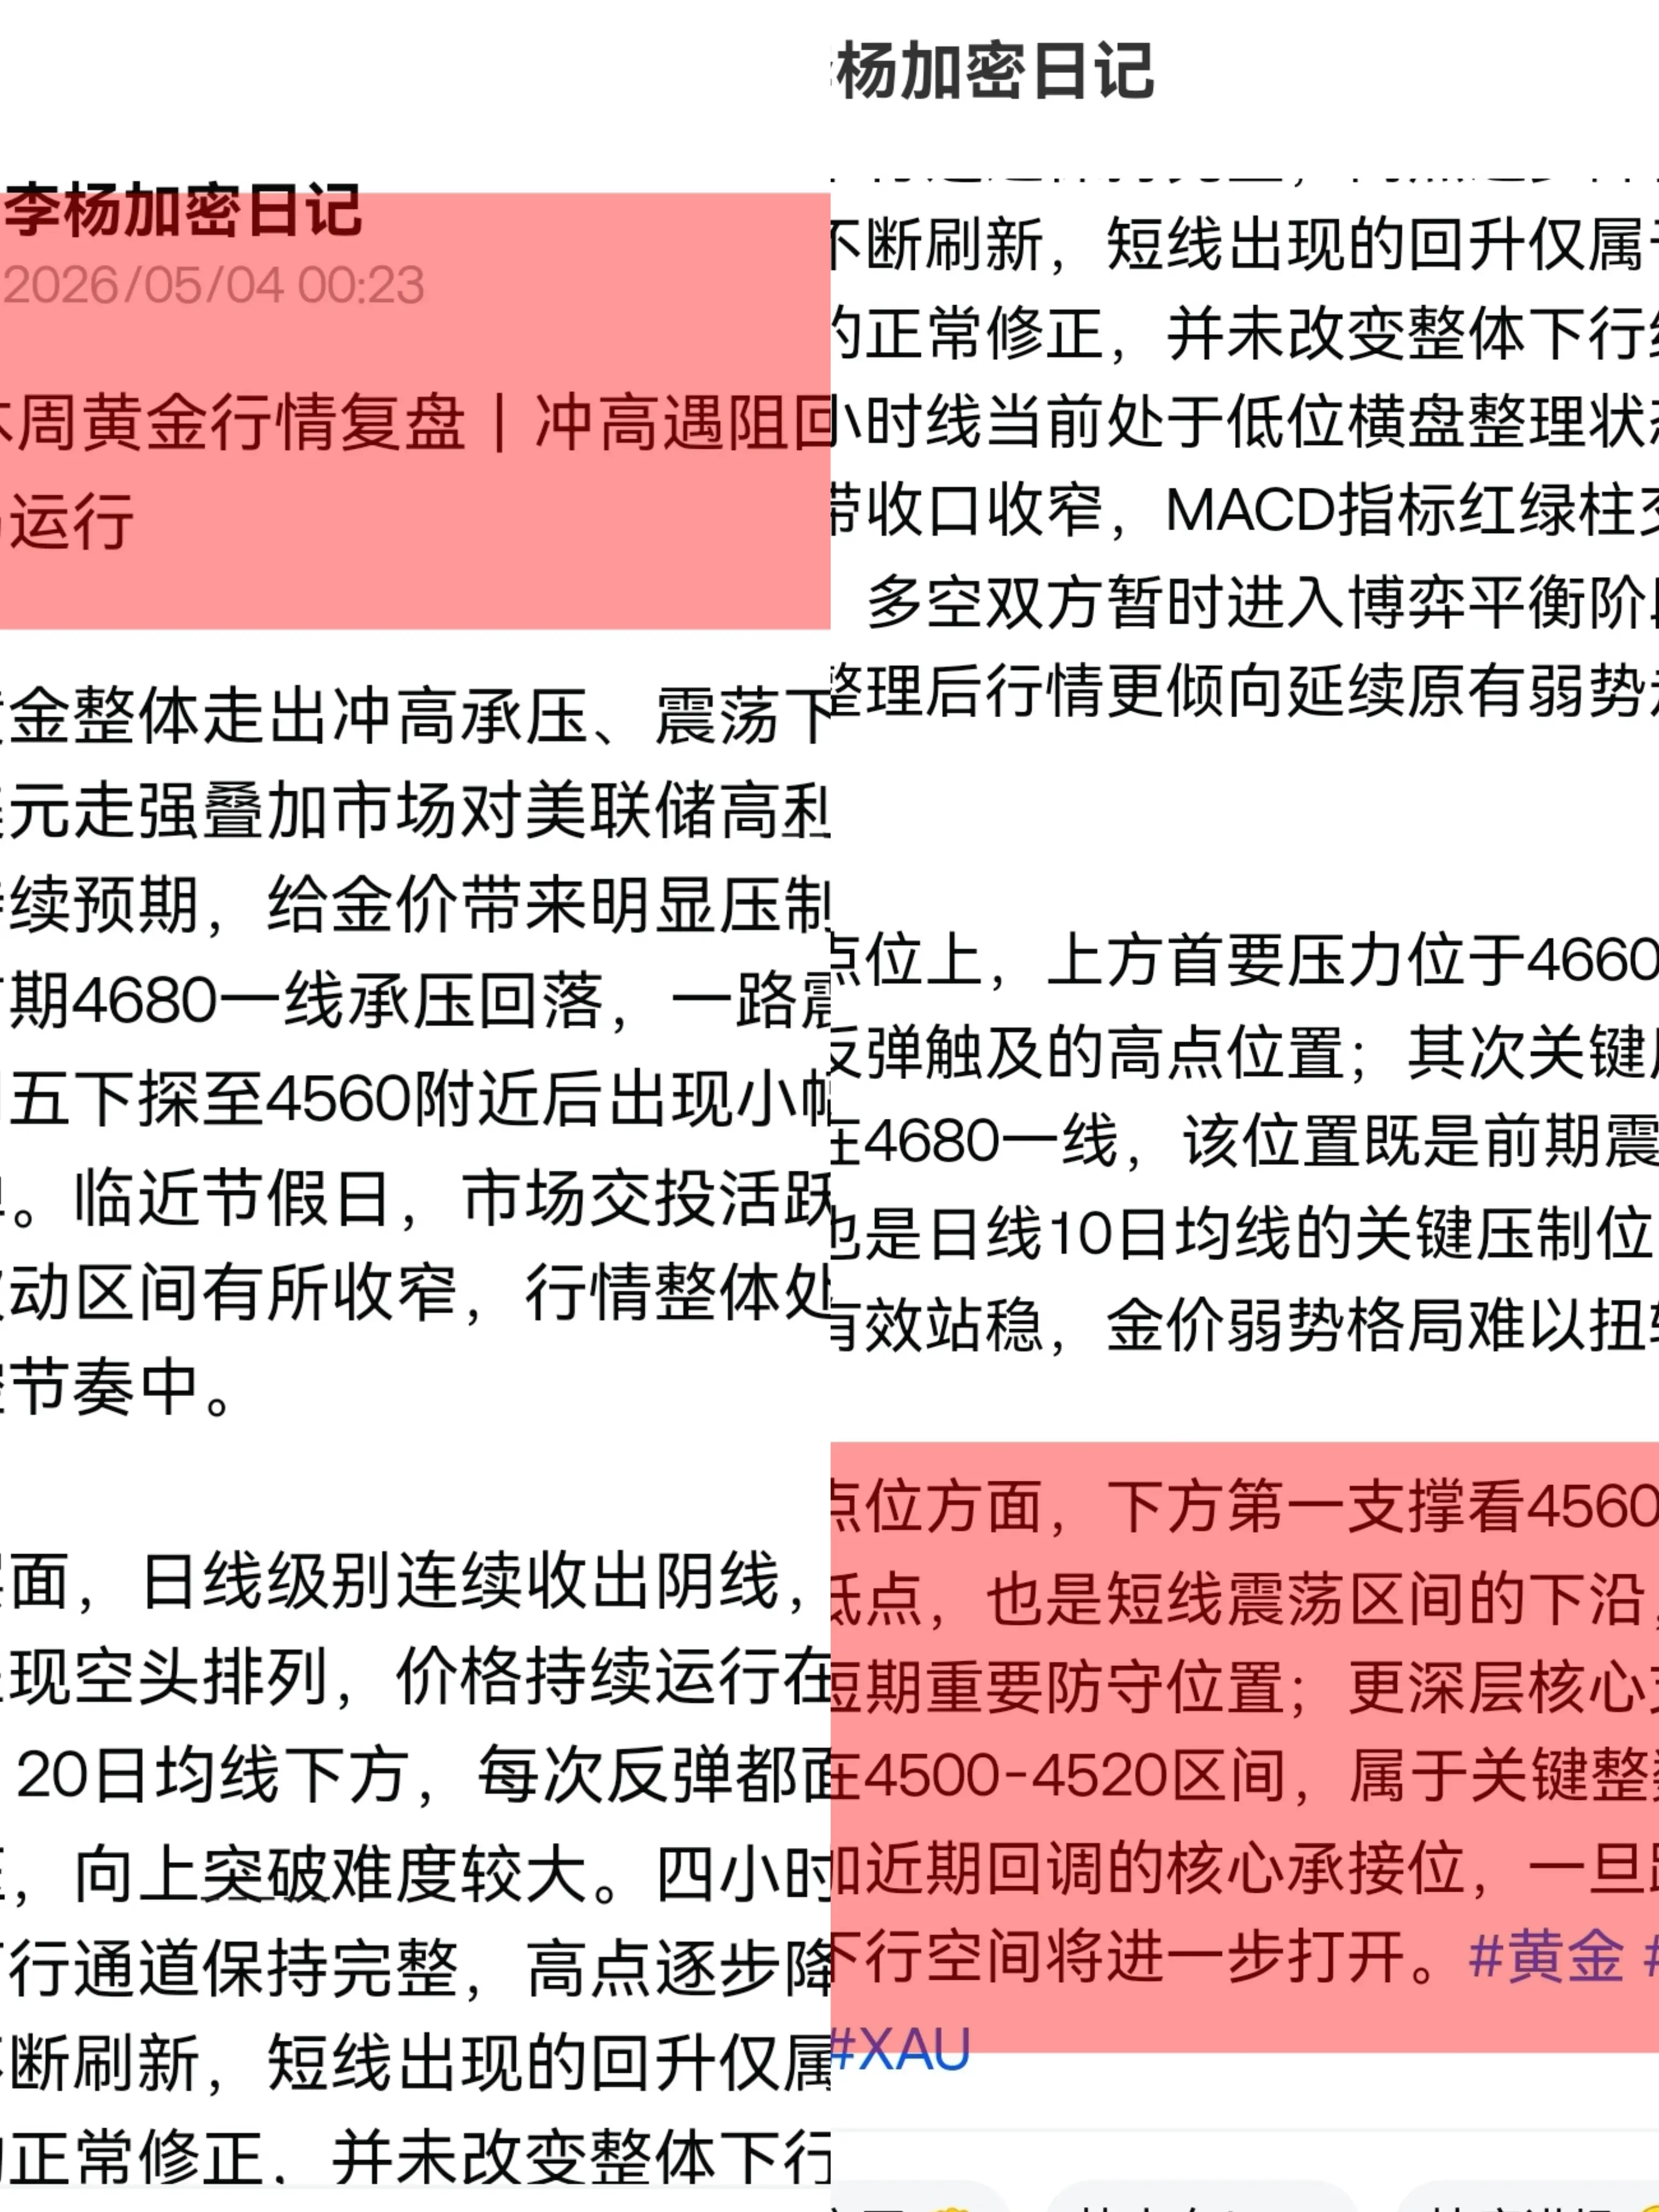

5. Weekly Gold Market Review | Rallies Meet Resistance and Pull Back, Overall Weak Performance
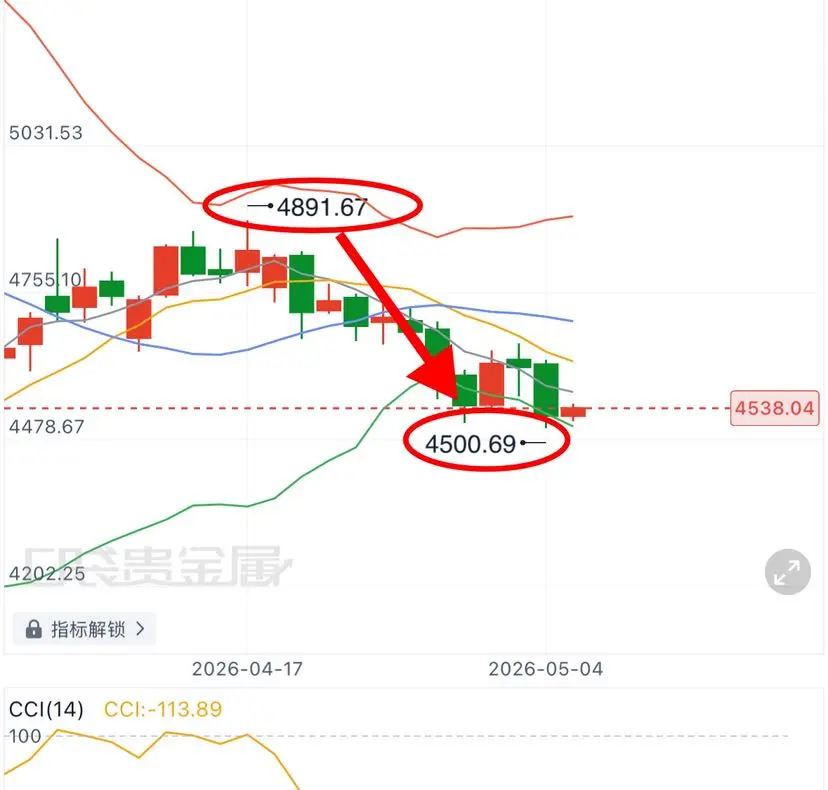
This week, gold prices showed a pattern of rising to resistance and then pulling back, with a generally downward trend. The strengthening dollar combined with ongoing market expectations of high interest rates from the Federal Reserve exerted clear pressure on gold prices. Prices declined from the previous resistance level around 4680, fluctuating lower all week, and on Friday, dipped near 4560 before experiencing a slight technical rebound. As the holiday approaches, market activity has decreased, volatility has narrowed, and the overall trend remains dominated by a bearish rhythm.
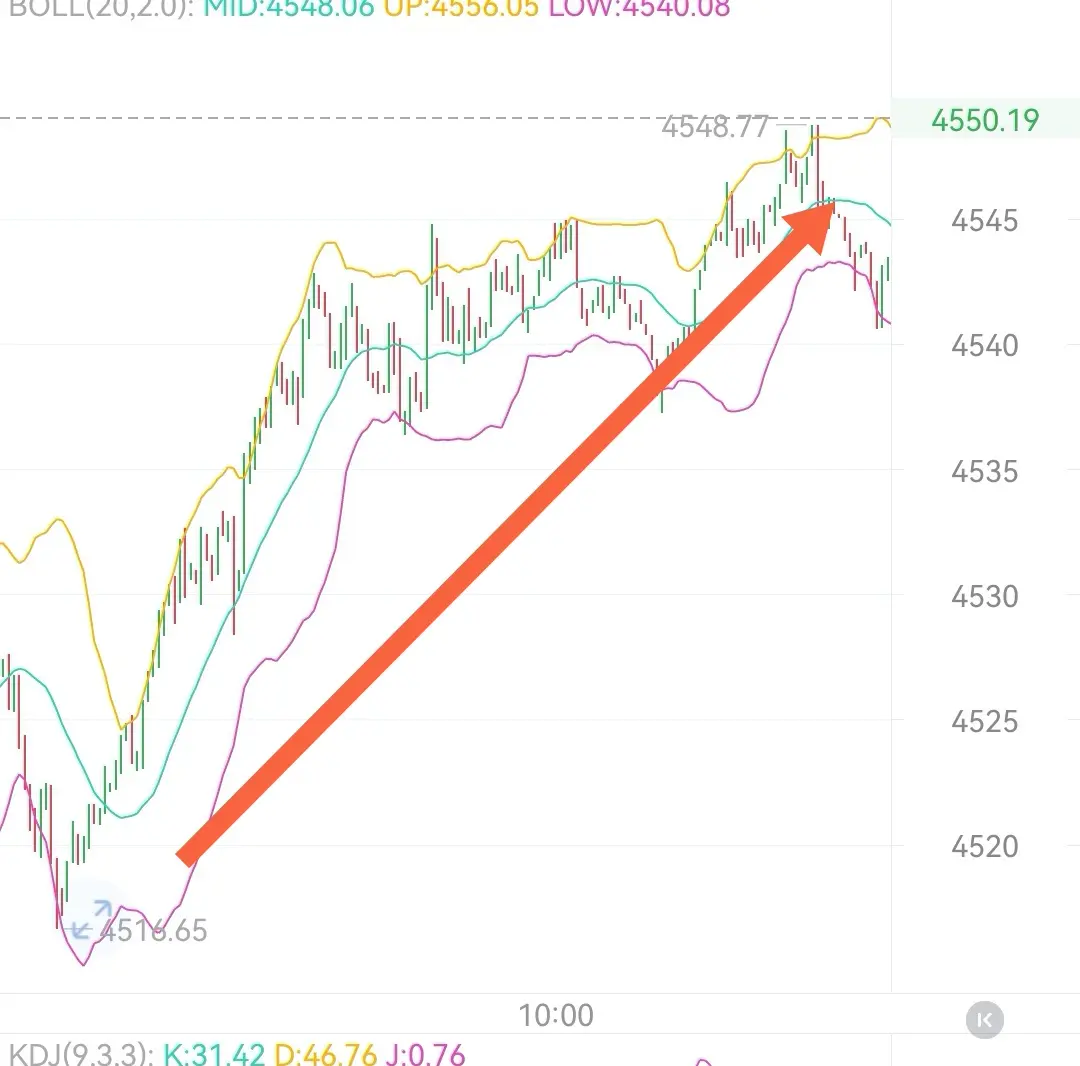
On the technical side, daily candles have consecutively closed as bearish (downward) candles, with short-term moving averages showing a bearish alignment. Prices continue to stay below the 5-day, 10-day, and 20-day moving averages, with each rebound facing strong resistance, making upward breakthroughs difficult. On the four-hour chart, the downward channel remains intact, with highs gradually decreasing and lows continuously being refreshed. The short-term rebound is merely a normal correction after a decline and does not change the overall downward structure. The hourly chart is currently in a sideways consolidation at low levels, with Bollinger Bands narrowing and MACD indicators alternating between red and green bars. Both bulls and bears are temporarily in a balanced standoff, and after a period of consolidation, the market is more likely to continue its existing weak trend.
Regarding resistance levels, the first key resistance is at 4660, the high point reached during Friday’s rebound; the next critical resistance is around 4680, which is both a previous consolidation platform and a key resistance at the daily 10-day moving average. If prices cannot stabilize above this level, the weak pattern of gold prices will be difficult to reverse.
On the support side, the first support level is at 4560, the week's low and the lower boundary of the short-term consolidation range, serving as an important short-term defense level for bulls. A deeper core support is concentrated in the 4500-4520 zone, which is a critical integer level combined with recent pullbacks, serving as a key zone for support. If broken, the downside space will further open up.
This week, gold prices showed a pattern of rising to resistance and then pulling back, with a generally downward trend. The strengthening dollar combined with ongoing market expectations of high interest rates from the Federal Reserve exerted clear pressure on gold prices. Prices declined from the previous resistance level around 4680, fluctuating lower all week, and on Friday, dipped near 4560 before experiencing a slight technical rebound. As the holiday approaches, market activity has decreased, volatility has narrowed, and the overall trend remains dominated by a bearish rhythm.
On the technical side, daily candles have consecutively closed as bearish (downward) candles, with short-term moving averages showing a bearish alignment. Prices continue to stay below the 5-day, 10-day, and 20-day moving averages, with each rebound facing strong resistance, making upward breakthroughs difficult. On the four-hour chart, the downward channel remains intact, with highs gradually decreasing and lows continuously being refreshed. The short-term rebound is merely a normal correction after a decline and does not change the overall downward structure. The hourly chart is currently in a sideways consolidation at low levels, with Bollinger Bands narrowing and MACD indicators alternating between red and green bars. Both bulls and bears are temporarily in a balanced standoff, and after a period of consolidation, the market is more likely to continue its existing weak trend.
Regarding resistance levels, the first key resistance is at 4660, the high point reached during Friday’s rebound; the next critical resistance is around 4680, which is both a previous consolidation platform and a key resistance at the daily 10-day moving average. If prices cannot stabilize above this level, the weak pattern of gold prices will be difficult to reverse.
On the support side, the first support level is at 4560, the week's low and the lower boundary of the short-term consolidation range, serving as an important short-term defense level for bulls. A deeper core support is concentrated in the 4500-4520 zone, which is a critical integer level combined with recent pullbacks, serving as a key zone for support. If broken, the downside space will further open up.