OldCatInTheCryptoCi
vip
Age0Year
Peak Tier0
No content yet
Market Analysis for the Morning of August 15
The pancake dipped to a low of 117000 this morning and is now around 118200.
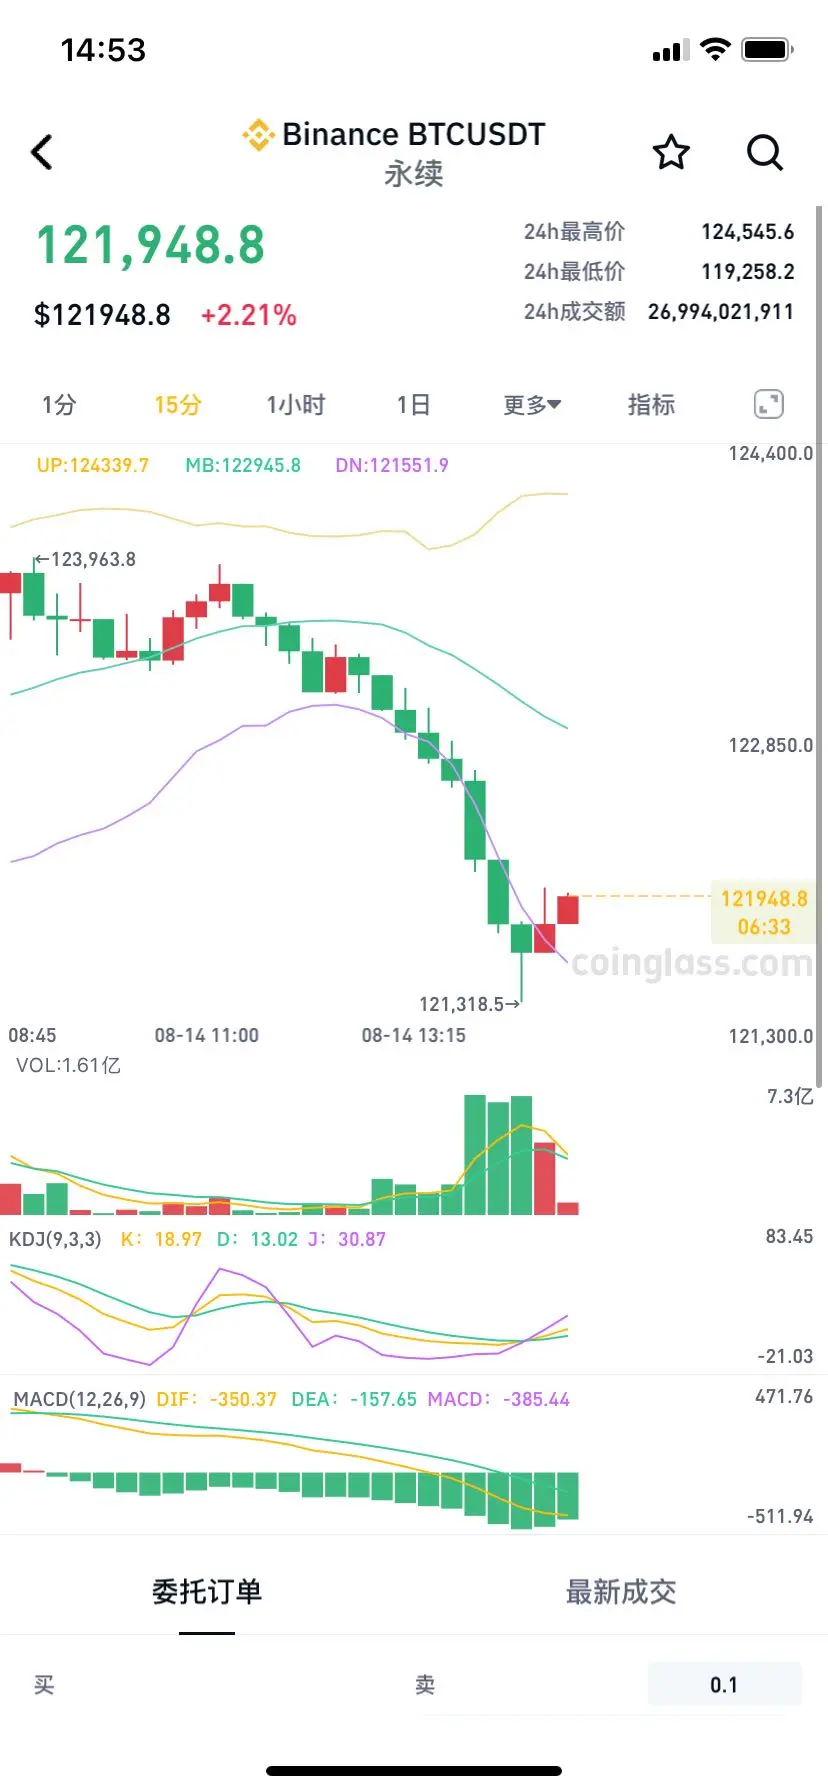
According to the 1-hour chart: Bitcoin is at the upper band of the Bollinger Bands moving towards the middle band, KDJ is trending downwards, and the bearish volume is shrinking.
Operational Idea: Short if BTC rebounds to 118500-119300, watch around 117600-117000;
Ethereum is around 4560 to over 4600, looking near 4500-4460.
BTC-2.18%
ETH-1.92%
View Original
  • Reward
  • Comment
  • Repost
  • Share
Market analysis on the evening of August 14
The pancake reached a high of around 124500 this morning and has since continued to rise, currently around 118000.
According to the 1-hour chart: Bitcoin is at the upper Bollinger Band, KDJ is trending downwards, and the bearish volume is increasing.
Operation idea: The big pie will pull back to 117500-116800 tonight, looking at around 118500-119300;
Ethereum is fluctuating between 4520 and 4480, with a target around 4700-4660.
BTC-2.18%
ETH-1.92%
View Original
  • Reward
  • Comment
  • Repost
  • Share
The situation is not right, retreat quickly.
View Original
post-image
  • Reward
  • Comment
  • Repost
  • Share
Ethereum's "Wall Streetization": Opportunity or Risk?
1. The Truth Behind the Plunge
From the end of 2024 to April 2025, ETH dropped from $4000 to $1500, seeming like a crash, but in fact, it was the process of institutions accumulating at low prices. Retail investors panicked and sold off, while whales and institutions seized the opportunity to buy in, significantly increasing the concentration of chips.
2. Who is bottom fishing?
Public companies: such as SBET (buying ETH for $425 million), BMNR (investing $250 million in staking), treating ETH as a "digital treasury bond."
Capital giants: Pa
ETH-1.92%
DEFI-2.74%
BTC-2.18%
View Original
  • Reward
  • Comment
  • Repost
  • Share
Heatmap Analysis Concept:
There are currently two types of opinions in the market.
Pessimists: believe that the cryptocurrency market has reached a historical peak, mainly based on the 21-year BTC weekly divergence.
Optimists: believe that there will be a comprehensive surge in August and September, and they will work tirelessly.
Big B:
Downward support to pay attention to: the primary support is around 122600, and the secondary support is around 121300. If the downward momentum is strong, the key support area is below 120500.
Upside resistance to watch: initial resistance is around 124500, se
BTC-2.18%
View Original
  • Reward
  • Comment
  • Repost
  • Share
Market analysis at noon on August 14
The pancake rose sharply after reaching a high of around 124500 in the morning, and is now around 121700.
According to the 1-hour chart: Bitcoin is at the upper band of the Bollinger Bands, and the KDJ is forming a golden cross upwards with reduced bearish volume.
Operational idea: Long Bitcoin at 121200-120700, looking to see around 122200-122900;
Short Ethereum near 4760 to 4790, targeting around 4700-4660.
BTC-2.18%
ETH-1.92%
View Original
  • Reward
  • Comment
  • Repost
  • Share
The layout in the morning was a pullback to go long, the direction was correct 👍, gaining over k points of space.
View Original
post-image
post-image
post-image
  • Reward
  • Comment
  • Repost
  • Share
Market Analysis at Noon on August 14
The pancake rose to around 124500 in the morning and has been continuously climbing, now at around 123450.
According to the 1-hour chart: Bitcoin is at the upper Bollinger Band position, and the KDJ indicator is forming a death cross as it moves down.
Operating idea: Long Bitcoin at 122900-122300, looking at around 123950-124650;
Short Ethereum around 4790 to 4820, aiming for a target near 4745-4700.
BTC-2.18%
ETH-1.92%
View Original
  • Reward
  • Comment
  • Repost
  • Share
### Ethereum (ETH) 2025 Performance Analysis and Future Outlook
#### 1. Overview of Key Changes in ETH for 2025
1. Price Surge: Beginning of the year $1,823 → August surpasses $4,210 (year-to-date high $4,358), an increase of over 130%, with daily trading volume between $4.5-4.9 billion.
2. Technical Upgrade:
- The Fusaka hard fork (expected to launch in Q4 2025) will enhance L2 scalability, reduce Gas fees further, and increase DeFi TVL from $50 billion to $120 billion.
- Layer2 dominance (such as Arbitrum) handles 70% of transactions, with a surge in ecosystem activity.
3. Institution
ETH-1.92%
DEFI-2.74%
ARB-4.37%
BTC-2.18%
View Original
  • Reward
  • Comment
  • Repost
  • Share
Market maker trading tactics: The truth about selling more as the price rises.
1. The Illusion of Support Level
- The support level you think is actually the market maker's cost line.
- Fake breakout: market makers intentionally crash the market to scare you into cutting losses
- True breakdown: Volume breakdown = market maker has completely fled
2. The rhythm of market makers unloading their positions
① Rise and sell: increase while selling, attracting retail investors to take over.
② Sideways distribution: oscillating up and down, slowly liquidating positions
③ Dumping: The last 10% drop lur
View Original
  • Reward
  • Comment
  • Repost
  • Share
[crypto world midday news] BTC is experiencing high-level fluctuations, and the Bull vs Bear Battle is intensifying!
🔥【BTC Update】
- Current Price: 123,500 USD (narrow fluctuation)
- After rising to 124,500 USD in the morning, it fell back.
- The Bollinger Bands are opening upwards on the 1-hour level.
- Danger Signal: KDJ Dead Cross + MACD Bullish Volume Contraction
🎯【Key Points】
✅ Bullish defense line: 123,000-122,500 (strong support area)
✅ Pullback observation: 124,100-124,800 dollars (pressure conversion point)
💎[ETH Operation Suggestions]
🔄 The current price range of 4750-4790 can op
BTC-2.18%
ETH-1.92%
DYOR-9.69%
View Original
  • Reward
  • Comment
  • Repost
  • Share
Market analysis on the morning of August 14 shows that BTC has slightly pulled back from the morning high of 123,100 USD and is currently fluctuating around 122,900 USD. From a technical perspective, the 1-hour Bollinger Bands continue to run upwards, the KDJ indicator is diverging upwards, and the MACD is also showing an increase in long positions, indicating that there is still upward momentum in the short term. It is recommended to follow two key ranges for BTC: watch for a rebound space at 123,600-124,200 USD above, and pay attention to the support area at 122,600-121,800 USD below; for ET
BTC-2.18%
ETH-1.92%
View Original
  • Reward
  • Comment
  • Repost
  • Share
Don't panic, I just know you're definitely going up.
View Original
post-image
post-image
  • Reward
  • Comment
  • Repost
  • Share
  • Topic
  • Pin
Trade Crypto Anywhere Anytime
qrCode
Scan to download Gate app
Community
English
  • 简体中文
  • English
  • Tiếng Việt
  • 繁體中文
  • Español
  • Русский
  • Français (Afrique)
  • Português (Portugal)
  • Bahasa Indonesia
  • 日本語
  • بالعربية
  • Українська
  • Português (Brasil)