Trade
Trading Type
Spot
Trade crypto freely
Alpha
Points
Get promising tokens in streamlined on-chain trading
Pre-Market
Trade new tokens before they are officially listed
Margin
Magnify your profit with leverage
Convert & Block Trading
0 Fees
Trade any size with no fees and no slippage
Leveraged Tokens
Get exposure to leveraged positions simply
Futures
Futures
Hundreds of contracts settled in USDT or BTC
Options
HOT
Trade European-style vanilla options
Unified Account
Maximize your capital efficiency
Demo Trading
Futures Kickoff
Get prepared for your futures trading
Futures Events
Participate in events to win generous rewards
Demo Trading
Use virtual funds to experience risk-free trading
Earn
Launch
Investment
Simple Earn
VIP
Earn interests with idle tokens
Auto-Invest
Auto-invest on a regular basis
Dual Investment
Buy low and sell high to take profits from price fluctuations
Quant Fund
VIP
Top asset management team helps you profit without hassle
Crypto Loan
0 Fees
Pledge one crypto to borrow another
Lending Center
One-Stop Lending Hub
VIP Wealth Hub
New
Customized wealth management empowers your assets growth
Staking
Stake cryptos to earn in PoS products
BTC Staking
HOT
Stake BTC and earn 10% APR
ETH Staking
HOT
Stake ETH and earn 10% APR
GUSD Minting
New
Use USDT/USDC to mint GUSD for treasury-level yields
Soft Staking
Earn rewards with flexible staking
More


- Trending TopicsView More
4.2K Popularity
4.7M Popularity
120.5K Popularity
78.8K Popularity
164.7K Popularity
- Pin
- 🍁 Golden Autumn, Big Prizes Await!
Gate Square Growth Points Lucky Draw Carnival Round 1️⃣ 3️⃣ Is Now Live!
🎁 Prize pool over $15,000+, iPhone 17 Pro Max, Gate exclusive Merch and more awaits you!
👉 Draw now: https://www.gate.com/activities/pointprize/?now_period=13&refUid=13129053
💡 How to earn more Growth Points for extra chances?
1️⃣ Go to [Square], tap the icon next to your avatar to enter [Community Center]
2️⃣ Complete daily tasks like posting, commenting, liking, and chatting to rack up points!
🍀 100% win rate — you’ll never walk away empty-handed. Try your luck today!
Details: ht - 💥 Gate Square Event: #Post0GWinUSDT# 💥
Post original content on Gate Square related to 0G or the ongoing campaigns (Earn, CandyDrop, or Contract Trading Competition) for a chance to share 200 USDT rewards!
📅 Event Period: Sept 25, 2025, 18:00 – Oct 2, 2025, 16:00 UTC
📌 Related Campaigns:
Earn: Enjoy stable earnings
👉 https://www.gate.com/announcements/article/47290
CandyDrop: Claim 0G rewards
👉 https://www.gate.com/announcements/article/47286
Contract Trading Competition: Trade to win prizes
👉 https://www.gate.com/announcements/article/47221
📌 How to Participate:
1️⃣ Post original cont - 🚀 #GateNewbieVillageEpisode2# ✖️ @独领风骚必暴富
💰 Share your first profit on Gate | 🎉 Recall your most unexpected gain | 🤝 Grow with the community
⏰ Event Date:Sept 24 04:00 – Sept 30 16:00 UTC+8
How to Join:
1️⃣ Follow Gate_Square + @独领风骚必暴富
2️⃣ Post on Gate Square with the hashtag #GateNewbieVillageEpisode2#
3️⃣ Share your first pot of gold or your most surprising profit on Gate—more detailed and interesting posts have a higher chance to win!
🎁 Rewards
3 lucky winners → Gate X RedBull Tumbler + $20 Futures Trial Voucher
If merchandise cannot be shipped, it will be replaced with a $30 Futures - 🚗 #GateSquareCommunityChallenge# Round 2 — Which coin is not listed on Gate Launchpad❓
Time to prove if you’re a true Gate veteran!
💰 Join the challenge — 5 lucky winners will share $50 in GT!
👉 How to participate:
1️⃣ Follow Gate_Square
2️⃣ Like this post
3️⃣ Comment with your answer
🗓️ Deadline: October 8, 2025, 24:00 (UTC+8) - 🥊 You’ve entered the Trading PK Arena, matching your opponent now...
One click to place an order and jump into the battle! Who will climb the leaderboard and claim the 👑?
Gate’s brand-new Indicators Radar feature is live! Here you can:
📈 Share your trades on the live candlestick chart to [Square] 👉️ https://www.gate.com/post
👀 Watch others’ trading moves in real time;
💬 Go head-to-head with fellow traders in the community!
Don’t just read—follow the tutorial below and get started 👇
📌 Note: This feature is available only on app version 7.20.5 or above.
Unlocking the Secrets of Cryptocurrency Influencers: Expert Strategies for Success
Ethereum's Price Dynamics: Recent Support Test and Future Outlook
Ethereum recently encountered a significant Fibonacci support level around $4,100. As anticipated, ETH reached this cluster and has since shown signs of recovery.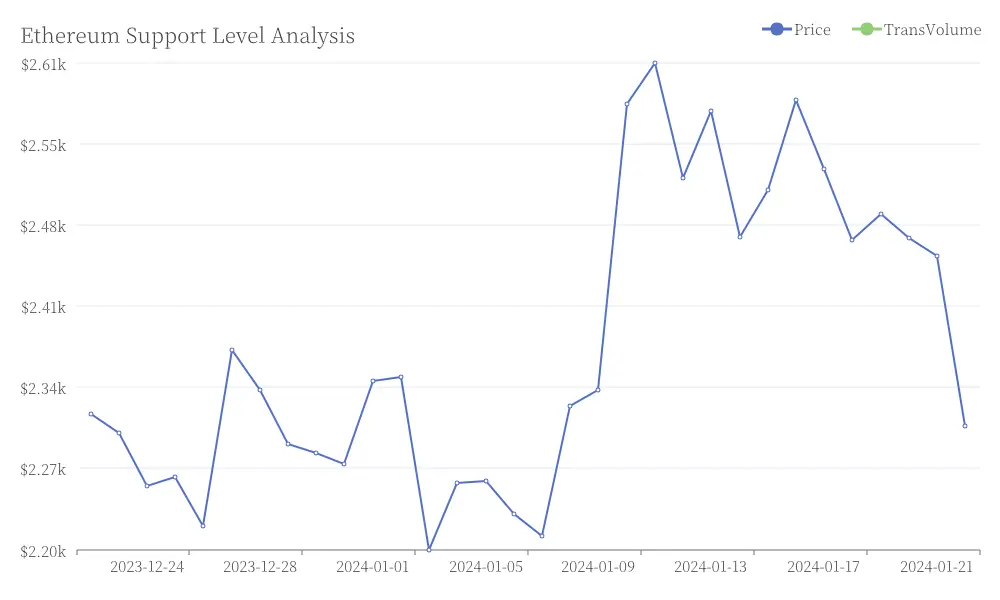 Ethereum Support Level Analysis
However, the question remains: Is this the beginning of a substantial rally or merely a temporary movement within a corrective wave?
Ethereum Support Level Analysis
However, the question remains: Is this the beginning of a substantial rally or merely a temporary movement within a corrective wave?
Critical Support Zones
Ethereum's price structure currently relies on several key support levels. The $4,100 mark serves as the immediate major liquidity cluster and current support base. Should this level fail, the next Fibonacci support awaits at $3,665, with a final crucial bullish structure defense point at $3,374. Breaking below this last threshold would significantly damage ETH's positive market structure.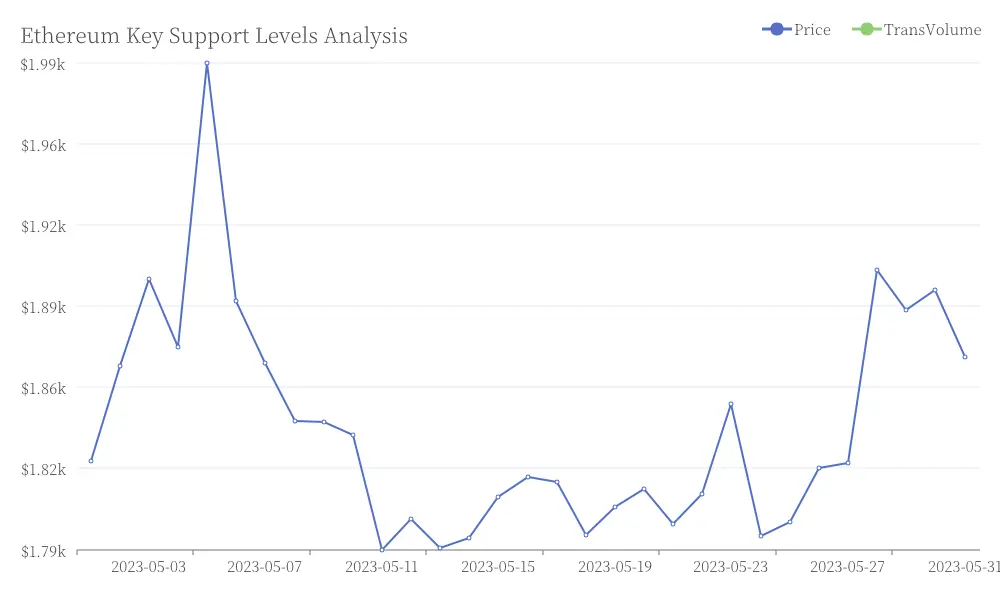 Ethereum Key Support Levels Analysis
Short-Term Price Action Analysis
Looking at recent lower timeframes, Ethereum has touched the $4,100 level in a liquidity sweep before bouncing back toward the 23.6% Fibonacci retracement level. Throughout this movement, ETH has maintained close alignment with Bitcoin, which also reached its corresponding 23.6% Fibonacci level. Currently, ETH continues forming lower lows and lower highs, signaling a bearish short-term structure, though indications suggest we may be entering the early stages of a B-wave bounce according to Elliott Wave analysis.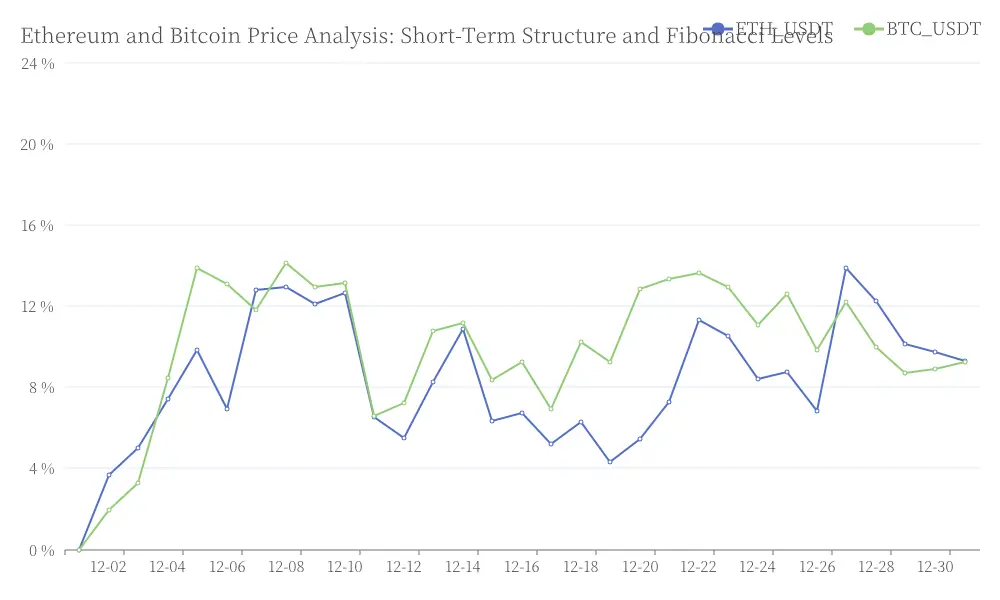 Ethereum and Bitcoin Price Analysis: Short-Term Structure and Fibonacci Levels
Elliott Wave Perspective on Ethereum's Movement
The recent descent to $4,100 could be classified as an A-wave, potentially forming either a leading diagonal or WXY structure. ETH now appears to be in a B-wave bounce phase, which could potentially surpass resistance levels before a subsequent C-wave pullback. A strong, overshooting B-wave would increase the likelihood that ETH will maintain levels above $4,100 in the broader corrective pattern.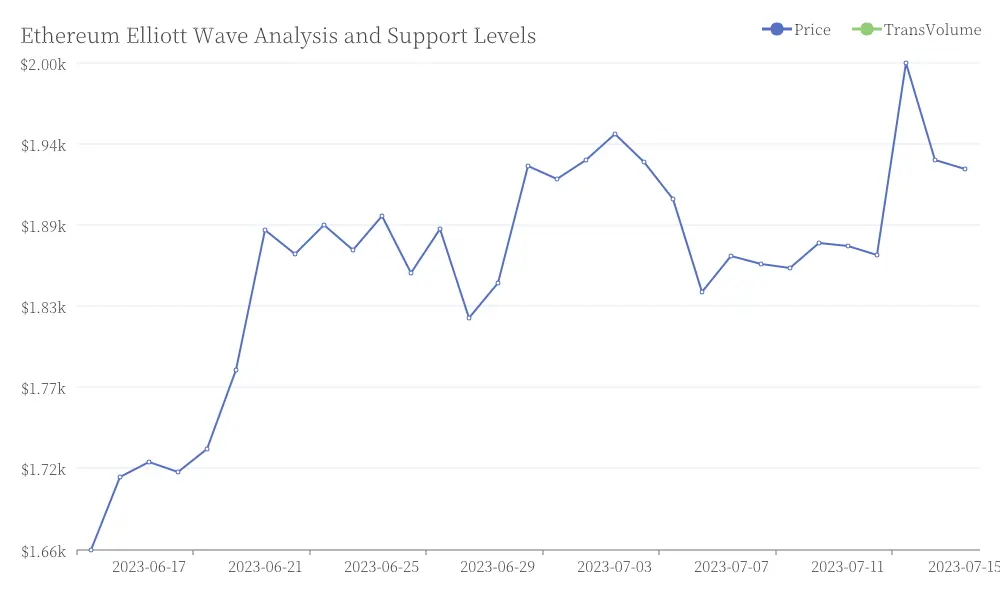 Ethereum Elliott Wave Analysis and Support Levels
Key Resistance Levels to Monitor
As Ethereum potentially continues its upward trajectory, important resistance zones stand at $4,331, $4,416, and the critical $4,500 threshold. Breaking above the $4,500 mark could potentially invalidate the current corrective structure, opening the path for Ethereum to reach new cycle highs.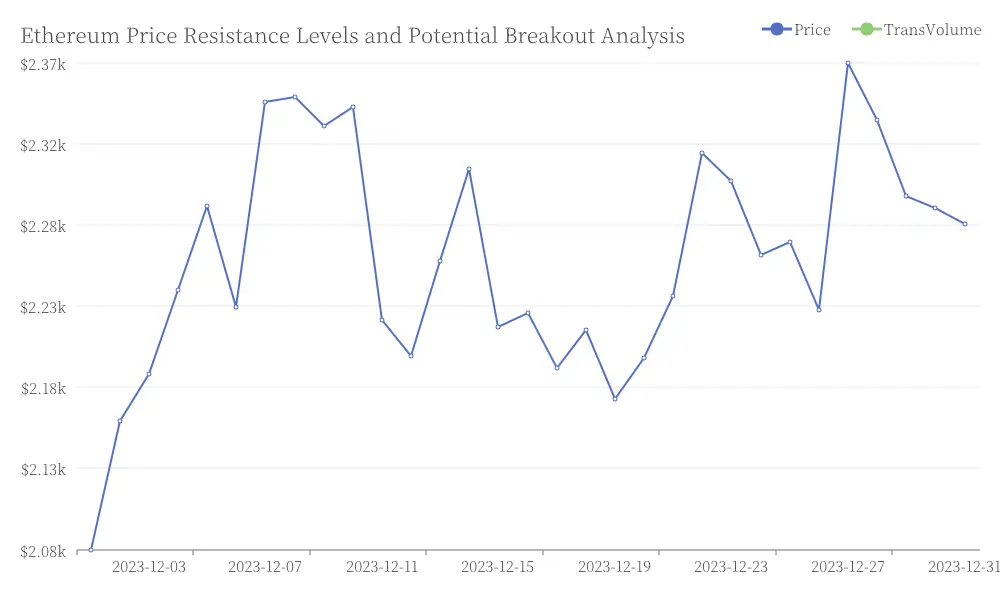 Ethereum Price Resistance Levels and Potential Breakout Analysis