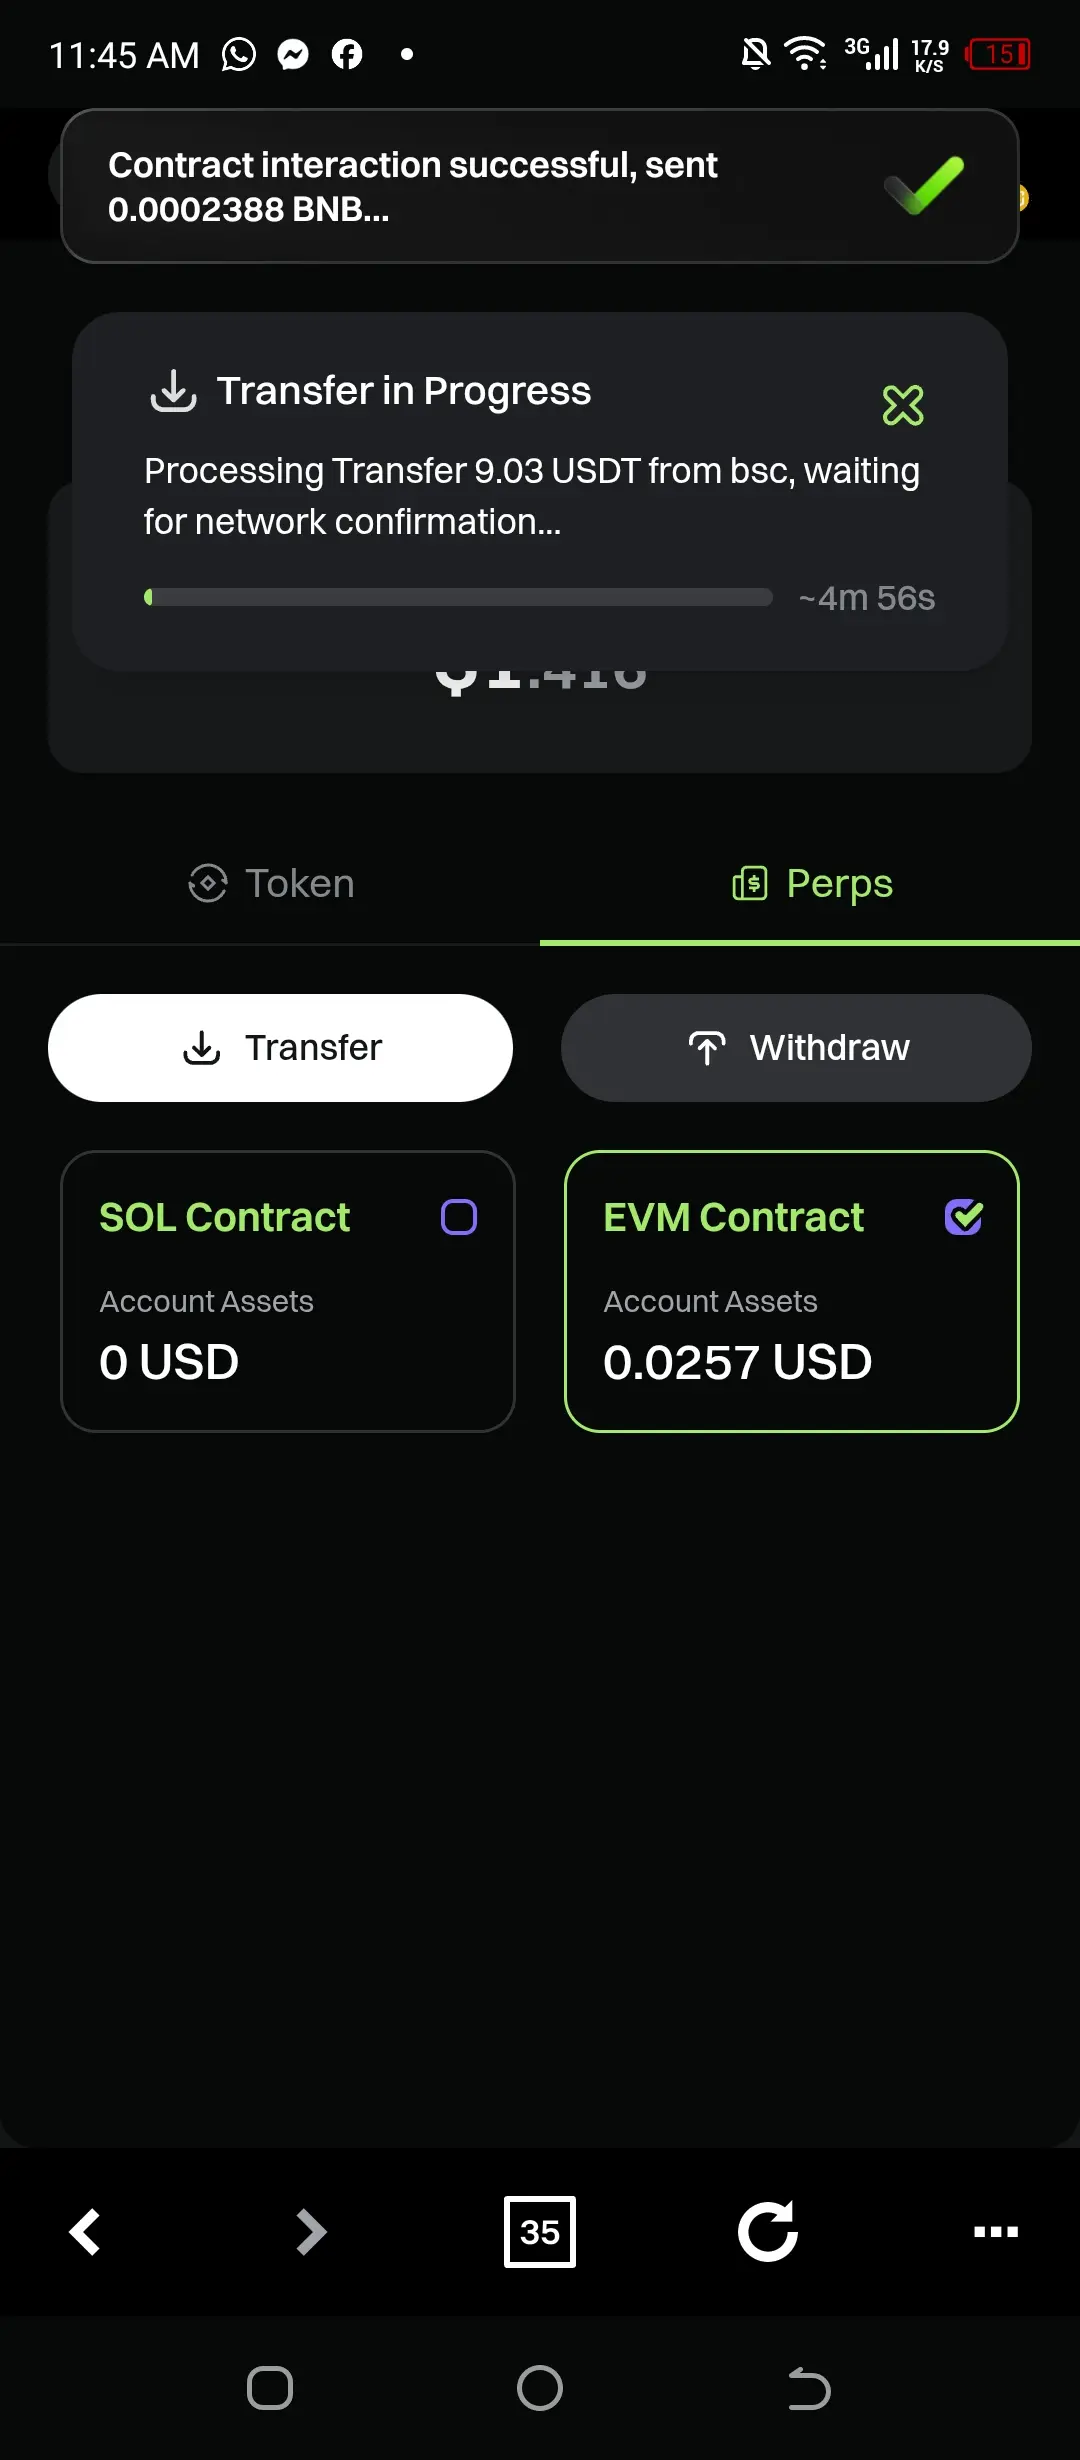
🚀 #GateVenturesAcquiresPerpDEXADEN – Uma Mudança de Jogo se Desdobra!
Grandes notícias no mundo das criptomoedas: a Gate Ventures acaba de adquirir a PerpDEX ADEN e isso pode reformular a forma como os derivados e as trocas descentralizadas operam.
🔍 Por Que Isso Importa
Derivados na blockchain? Sim — PerpDEX ADEN traz contratos perpétuos avançados + infraestrutura DEX.
Gate Ventures adiciona recursos financeiros profundos, rede e credibilidade — isso significa que a plataforma agora tem apoio para escalar.
Para traders e construtores: maior liquidez, alcance mais profundo e possivelmente menores taxas.
Mudança de ecossistema: quando um grande fundo adquire um projeto DEX, não é apenas uma transação — é um sinal de que a infraestrutura de finanças descentralizadas (DeFi) está a avançar.
💡 O Que Esperar
Lançamento de novos produtos de negociação construídos na tecnologia PerpDEX ADEN.
Integração no portfólio da Gate Ventures — pode significar incentivos em tokens, anúncios de parcerias e expansão entre cadeias.
Competição acentuada: Outras DEXs e plataformas de derivados responderão de forma intensa, o que significa que a inovação acelera.
Os primeiros adotantes podem beneficiar: Fique atento a Airdrops, eventos de lançamento, programas de incentivo ligados à aquisição.
📣 Chamada à Ação
Fique atento: Marque no seu calendário, siga a Gate Ventures & PerpDEX ADEN, e deixe um comentário:
“Qual recurso do PerpDEX ADEN você está mais entusiasmado após a aquisição?”
Marque seu círculo: compartilhe isso, convide sua rede e deixe-os saber que o crescimento do DEX + derivativos é real.

