Date: Fri, Dec 19 2025 | 09:34 AM GMT
The broader cryptocurrency market has been stuck in choppy conditions over the past several weeks, a phase that began after the sharp sell-off on October 10. That correction dragged Ethereum (ETH) lower by nearly 27% over the last 60 days, keeping sustained pressure on major altcoins, including Cardano (ADA).
ADA has suffered even deeper losses, sliding more than 45% over the same period. Yet despite the heavy drawdown, the weekly chart suggests the recent weakness may be bringing price into a technically important area, where a rebound attempt could begin to take shape.
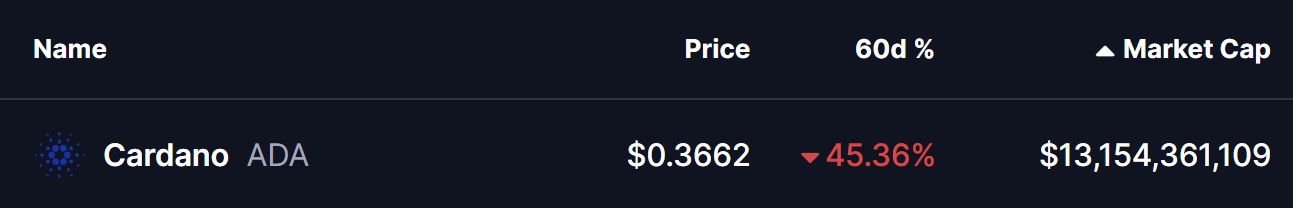
Source: Coinmarketcap
Broadening Wedge Setup in Play
On the weekly timeframe, Cardano continues to trade within an ascending broadening wedge — a structure defined by higher highs and higher lows that expand over time. While ascending broadening wedges are often viewed as risky from a longer-term perspective, they can still produce sharp counter-trend rebounds as price reacts to the lower boundary.
ADA’s latest sell-off followed a clear rejection from the upper wedge trendline near the $1.19 region earlier this year. That rejection triggered a steep decline of nearly 70%, dragging price back toward the lower boundary of the formation. The move ultimately found a floor near $0.3459, where selling pressure eased and buyers stepped in to defend the level.
Since then, ADA has managed to stabilize above the $0.3656 zone, suggesting that demand is beginning to emerge near the wedge’s lower trendline. This area has repeatedly acted as dynamic support throughout ADA’s broader structure, making it a critical level for the bulls to protect.
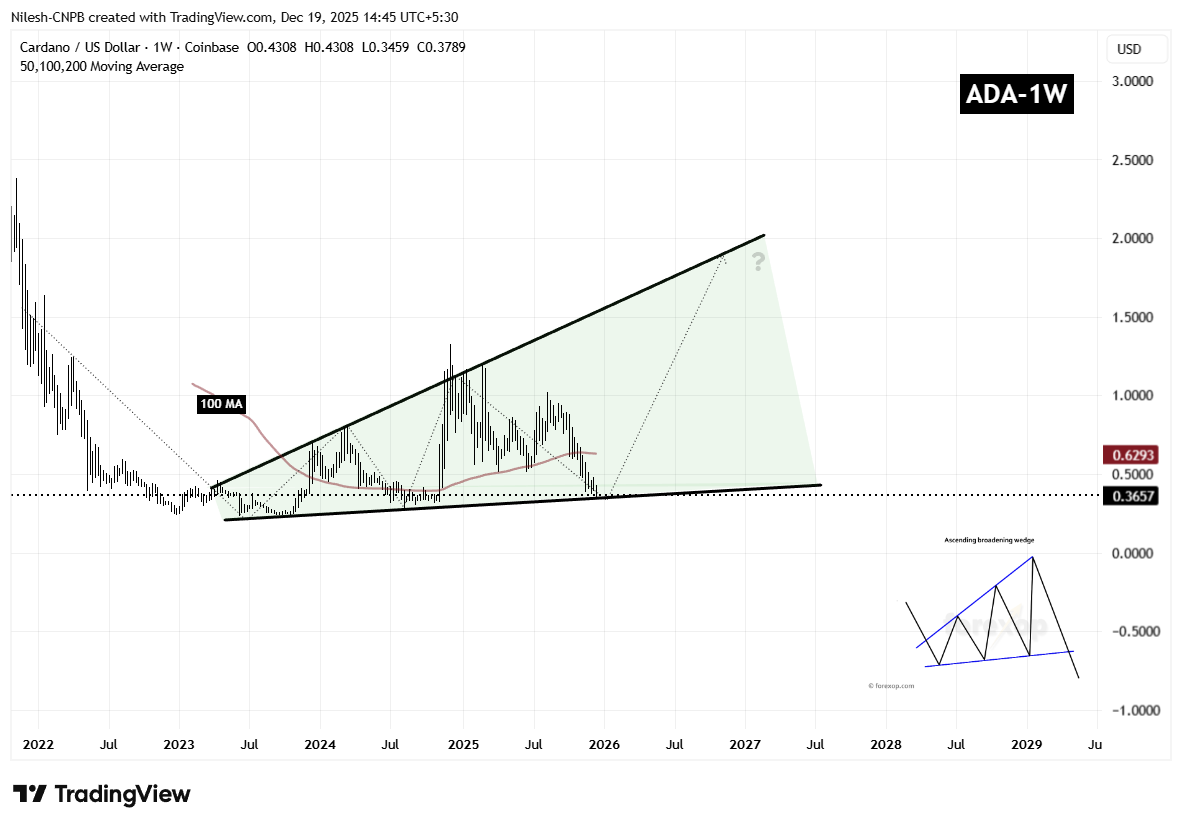
Cardano (ADA) Weekly Chart/Coinsprobe (Source: Tradingview)
At the same time, upside momentum remains capped by the 100-week moving average, currently positioned near $0.6293. This moving average has turned into a firm overhead resistance, and price will likely need a decisive break above it to confirm any sustained recovery attempt.
What Next for ADA?
As long as Cardano holds above the $0.34 support zone, the ascending broadening wedge structure remains intact. Continued defense of this level would keep the door open for a rebound, particularly if price begins to form higher weekly closes and challenges the 100-week moving average.
A successful reclaim of the $0.63 area could shift sentiment and pave the way for a larger recovery toward the upper boundary of the wedge, which currently aligns near the $1.90 region. Such a move would represent a major trend shift and signal that buyers have regained control after months of sustained downside pressure.
On the flip side, failure to hold the lower wedge boundary would tilt the balance back in favor of sellers. A confirmed breakdown below $0.34 could expose ADA to a deeper correction toward the $0.28 support zone, signaling that the bearish implications of the pattern are beginning to play out.
For now, Cardano finds itself at a pivotal technical crossroads. The market’s reaction around the lower wedge support will likely determine whether ADA can stage a meaningful bounce or slips into another leg of consolidation and downside pressure.
Disclaimer: The views and analysis presented in this article are for informational purposes only and reflect the author’s perspective, not financial advice. Technical patterns and indicators discussed are subject to market volatility and may or may not yield the anticipated results. Investors are advised to exercise caution, conduct independent research, and make decisions aligned with their individual risk tolerance.
Disclaimer: The information on this page may come from third parties and does not represent the views or opinions of Gate. The content displayed on this page is for reference only and does not constitute any financial, investment, or legal advice. Gate does not guarantee the accuracy or completeness of the information and shall not be liable for any losses arising from the use of this information. Virtual asset investments carry high risks and are subject to significant price volatility. You may lose all of your invested principal. Please fully understand the relevant risks and make prudent decisions based on your own financial situation and risk tolerance. For details, please refer to
Disclaimer.
Related Articles
BTC 15-minute rally of 0.85%: Fed policy shift and ETF capital resonance drive buying momentum
From 2026-03-12 09:30 to 2026-03-12 09:45 (UTC), Bitcoin (BTC) experienced a rapid surge within a 0.93% volatility range, achieving a return of +0.85%, with prices fluctuating between 69678.0 and 70324.2 USDT. Trading volume increased approximately 38% compared to the previous hourly average. Market attention surged significantly, with short-term bullish sentiment amplified notably.
The primary driver of this market movement was the Federal Reserve Chair's early morning release of policy shift signals, hinting that the pace of future rate hikes may slow down. The market broadly interpreted this as a marginal improvement in the liquidity environment
GateNews24m ago
PI Token Maintains Bullish Trend as Anticipation for Pi Day Grows
PI token trades above $0.21 after rallying over 25% in the past 7 days as anticipation for the upcoming Pi Day on March 14 grows.
PiScan recorded 3 million PI deposits to exchanges in 24 hours, suggesting near-term profit taking which could reverse the bullish trend.
Pi Network’s PI token tr
CryptoNewsFlash30m ago
Why Didn't BTC Drop During Geopolitical Conflicts? Answers From Binance's Fund Structure and CVD
The article analyzes the relationship between Binance's BTC balance changes and market demand, indicating that the decrease in BTC balances in the short term is related to genuine demand, especially during the US-Iran conflict. The widening gap in spot trading volume suggests active buying activity, supporting the presence of real demand. Although short-term demand may stabilize BTC prices, the long-term trend still leans downward, and the process of demand recovery could be lengthy.
PANews31m ago
Glassnode Data: Most XRP Supply in Loss, What It Means for Investors
Glassnode data shows 36.8 billion XRP, nearly 60% of the circulating supply, is held at a loss, with unrealized losses reaching $50.8 billion.
XRP traded near $1.34, while futures volume jumped on BitMEX and Binance as ETF outflows and weak spot activity kept pressure on price.
Glassnode dat
CryptoNewsFlash45m ago
23.38% Surge for OGN: What It Means for Investors
OGN's price surged 23.38% in 15 minutes, currently at $0.03356, driven by robust trading volume and market activity. Analysts cite macroeconomic factors and regulatory news influencing investor sentiment, while traders monitor key resistance and support levels.
Coinfomania48m ago
Bitcoin Supply Shock Imminent? Whale Holdings in Dormancy, Retail Selling Intensifies Price Volatility
The Bitcoin market is undergoing structural changes, with short-term holders selling off due to financial pressures, while long-term investors remain dormant, indicating potential supply shocks. Currently, Bitcoin is priced at $69,446, and although some holdings are at a loss, the stability of long-term holders could support the market. Analysts advise paying attention to on-chain indicators and whale activity to evaluate future price trends and liquidity risks.
GateNews1h ago