Date: Sat, Dec 20 2025 | 05:55 PM GMT
The broader cryptocurrency market has continued to struggle with uneven and choppy price action over the past several weeks, a phase that began after the sharp sell-off on October 10. That correction pushed Ethereum (ETH) lower by nearly 26% over the last 60 days, keeping sustained pressure across the altcoin market. Worldcoin (WLD) has been no exception, remaining under heavy selling pressure during this period.
WLD is down more than 44% over the past two months. While the short-term trend still leans bearish, the higher-timeframe chart is starting to show a structure that often appears near potential market turning points. If key technical levels are reclaimed, the current setup could evolve into a broader recovery attempt.
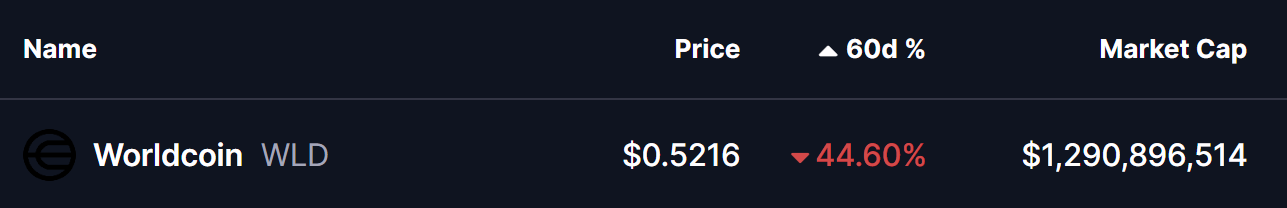
Source: Coinmarketcap
Power of 3 Pattern in Focus
On the higher-timeframe chart, WLD appears to be forming a classic Power of 3 structure, a pattern frequently associated with market cycle lows and trend transitions. This structure typically unfolds in three stages—accumulation, manipulation, and expansion—with the most decisive move usually emerging once the final phase begins.
Earlier, WLD spent an extended period moving sideways within a well-defined range between $0.6528 and $0.5628. This low-volatility environment, highlighted by the grey box on the chart, reflects the accumulation phase. During such phases, price action tightens, volatility fades, and longer-term participants often begin positioning quietly while broader sentiment remains weak or indifferent.
That stability eventually gave way as broader market pressure intensified. WLD broke below the $0.5628 support and slid to a recent low near $0.4721 before attempting a modest rebound. This sharp downside move aligns closely with the manipulation phase of the Power of 3 pattern. Such breakdowns are often designed to trigger stop-losses and force capitulation, shaking out weaker holders before price looks for a base.
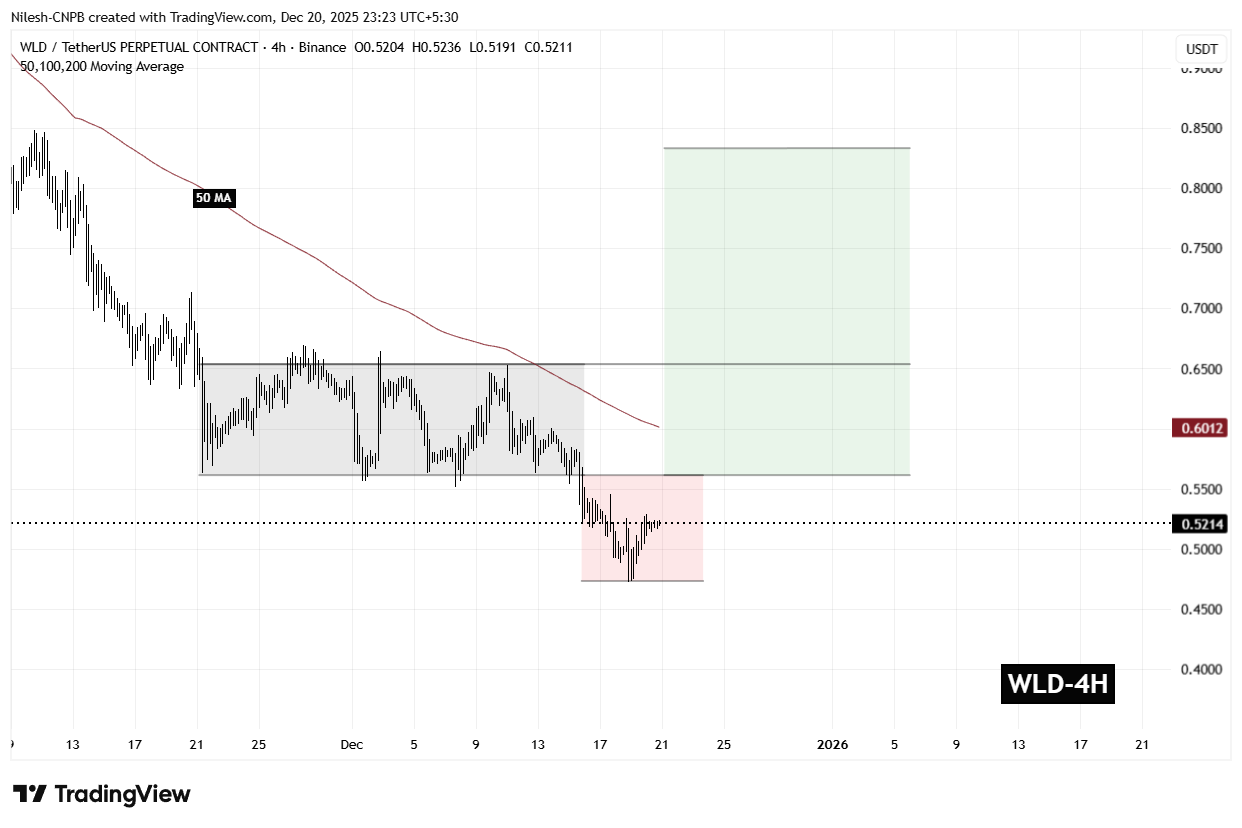
Worldcoin (WLD) 4H Chart/Coinsprobe (Source: Tradingview)
Notably, selling momentum has started to slow near this lower zone. Recent candles show reduced downside follow-through, suggesting that bearish pressure may be losing strength as price consolidates after the breakdown.
What’s Next for WLD?
At the time of writing, WLD continues to trade within the broader manipulation zone, which calls for caution. Price remains below the 50-period moving average near $0.6012, an area that now acts as an important short-term resistance. A sustained move back above this level would be an early signal that sellers are losing control.
For the bullish scenario to gain traction, WLD needs to reclaim both the $0.5628 level and establish acceptance above the $0.60–$0.65 resistance zone. A successful recovery into this former range would suggest that the manipulation phase has likely concluded and that the market may be transitioning toward the expansion phase of the structure.
If buyers manage to break and hold above $0.6528, the chart projection opens the door for a move toward the $0.83 region, which represents the measured expansion target and implies a potential upside of roughly 59% from current levels.
That said, this setup remains conditional. As long as WLD trades below $0.5628, downside risks cannot be ruled out, and the market remains vulnerable to further volatility. Holding recent lows and reclaiming key resistance levels will be critical for bulls looking to validate a bullish reversal narrative.
Disclaimer: The views and analysis presented in this article are for informational purposes only and reflect the author’s perspective, not financial advice. Technical patterns and indicators discussed are subject to market volatility and may or may not yield the anticipated results. Investors are advised to exercise caution, conduct independent research, and make decisions aligned with their individual risk tolerance.
Disclaimer: The information on this page may come from third parties and does not represent the views or opinions of Gate. The content displayed on this page is for reference only and does not constitute any financial, investment, or legal advice. Gate does not guarantee the accuracy or completeness of the information and shall not be liable for any losses arising from the use of this information. Virtual asset investments carry high risks and are subject to significant price volatility. You may lose all of your invested principal. Please fully understand the relevant risks and make prudent decisions based on your own financial situation and risk tolerance. For details, please refer to
Disclaimer.
Related Articles
PEPE Consolidates Above $0.05324 Support as Momentum Strengthens and Resistance Near $0.05336 Holds
PEPE has a tight intraday price compression with a support level of $0.053243 and resistance level of $0.053363.
A RSI of 64.13 represents the moderate bullish momentum whereas MACD history is slightly positive, which indicates the gradual buying momentum.
The price is at $0.053364
CryptoNewsLand2m ago
HYPE Hits $35.53 After 2.4% Jump — Will Momentum Hold as Price Tests $35.59 Resistance?
Hyperliquid’s HYPE trades at $35.53, approaching the $35.59 resistance after a 2.4% daily gain.
The chart shows the $33.67 zone acting as support after price moved above a previously contested level.
Price now trades between $33.67 support and $35.59 resistance, shaping the immediate
CryptoNewsLand11m ago
TAO Price Pumps Another 20% as Bittensor Delivers What No Other AI Crypto Could
Bittensor's TAO token surged 20% today, achieving over 60% gains in the last month, following the completion of a groundbreaking decentralized language model. Market sentiments are high, signaling strong investor interest in Bittensor's technology.
CaptainAltcoin37m ago
BTC 15分钟下跌0.67%:宏观避险情绪与衍生品去杠杆共振放大卖压
2026年3月13日15:30至15:45(UTC),比特币(BTC)在71886.1至72602.0 USDT区间震荡,振幅0.99%,最终15分钟内下跌0.67%。该时段成交量较前一小时显著放大,多头仓位出现集中止损,短线波动引发市场高度关注,情绪维持极度谨慎。
本次异动的主要驱动力在于全球地缘政治局势紧张和通胀预期走高。美国与伊朗冲突升级导致布伦特原油价格维持在100美元/桶以上,市场对
GateNews51m ago
BTC 15分钟下跌1.06%:油价冲击与杠杆强平共振引发抛售压力
2026-03-13 14:30 至 14:45(UTC),BTC在15分钟内收益率录得-1.06%,K线价格区间为72933.4至73896.0 USDT,振幅达1.31%。短时间市场波动明显加剧,交易活跃度与关注度同步走高。
本次异动的主要驱动力是全球油价因美以对伊朗军事行动急飙至100美元上方,触发通胀预期升温和美联储降息可能性的下降,导致全球风险偏好大幅回撤。比特币作为流动性最强的风险
GateNews1h ago
Bitcoin Shows Value Bottom Signals but True Market Floor Missing
Bitcoin is at a "Value Bottom" ideal for long-term dollar-cost averaging, but has not yet reached a "Structural Bottom," leading to projected volatility between $60K-$70K. Investors should prepare for continued fluctuations and potential buying opportunities.
BlockChainReporter2h ago