


#CryptoMarketsDipSlightly
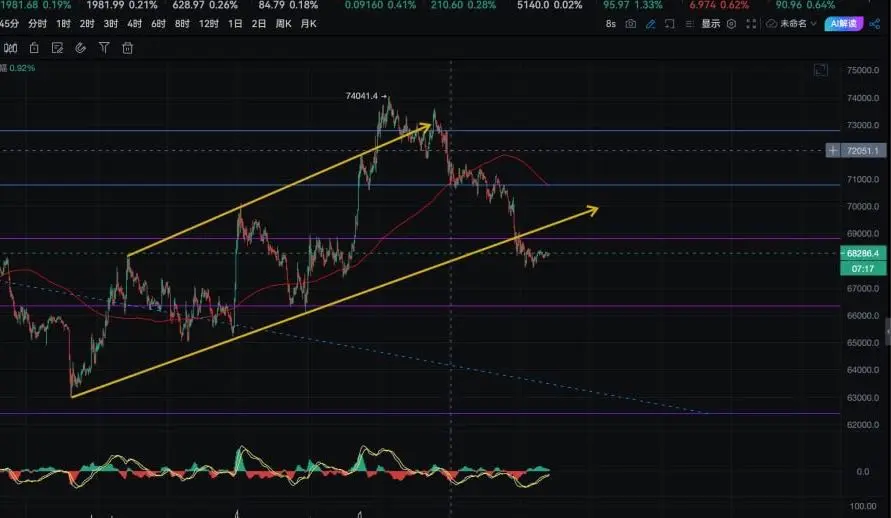
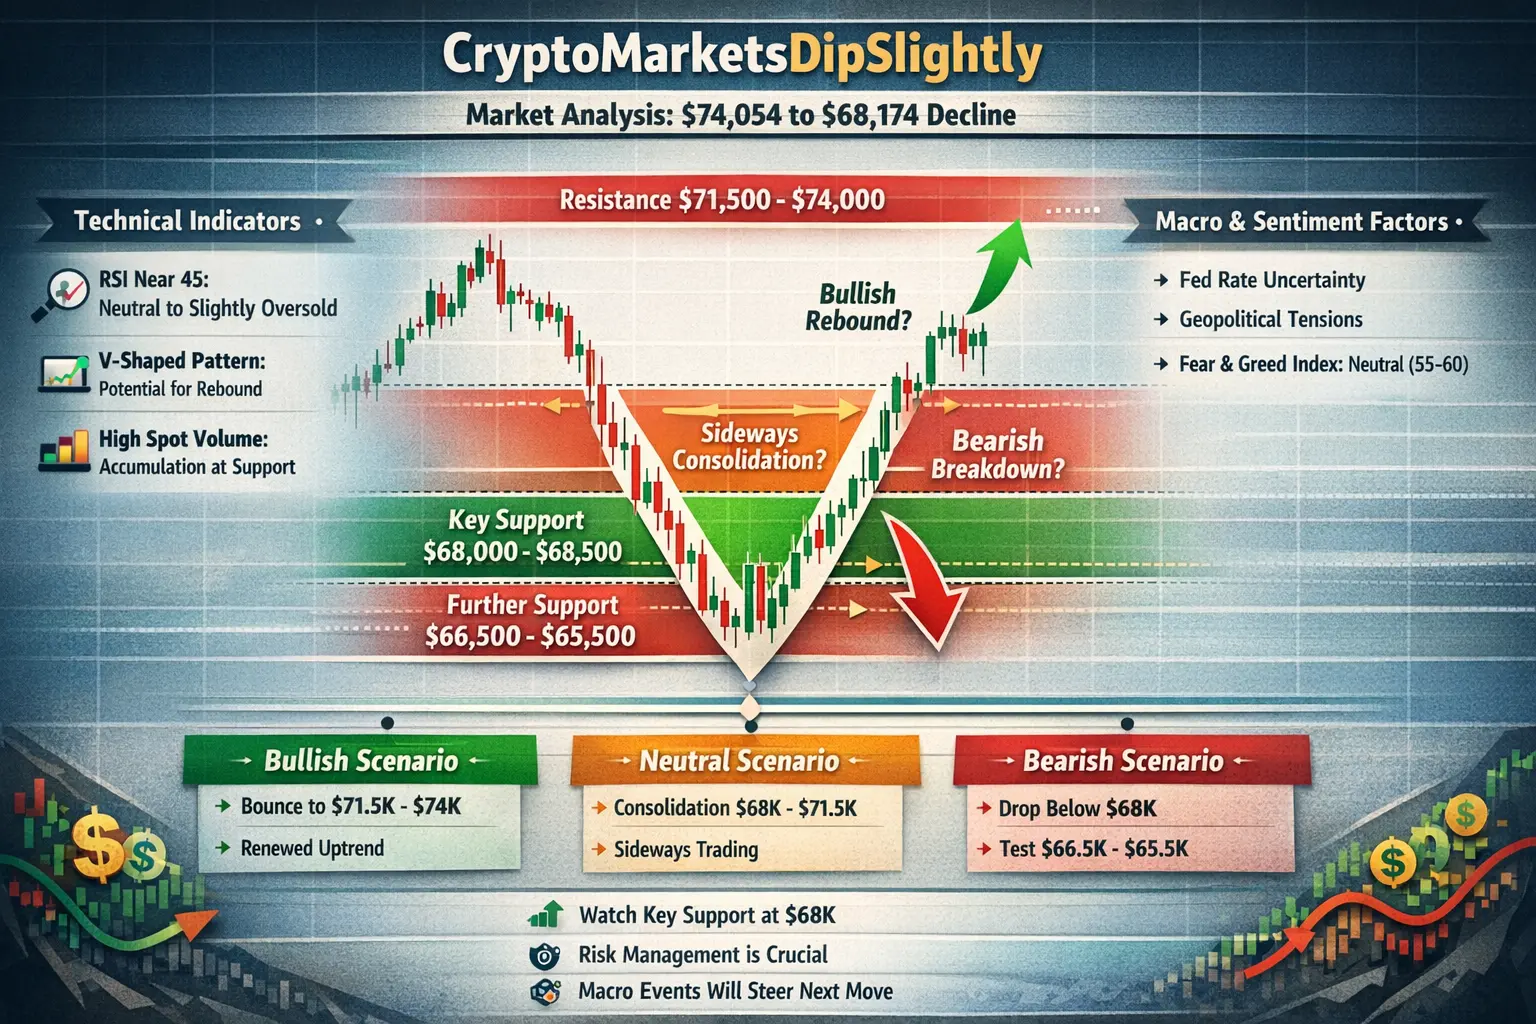
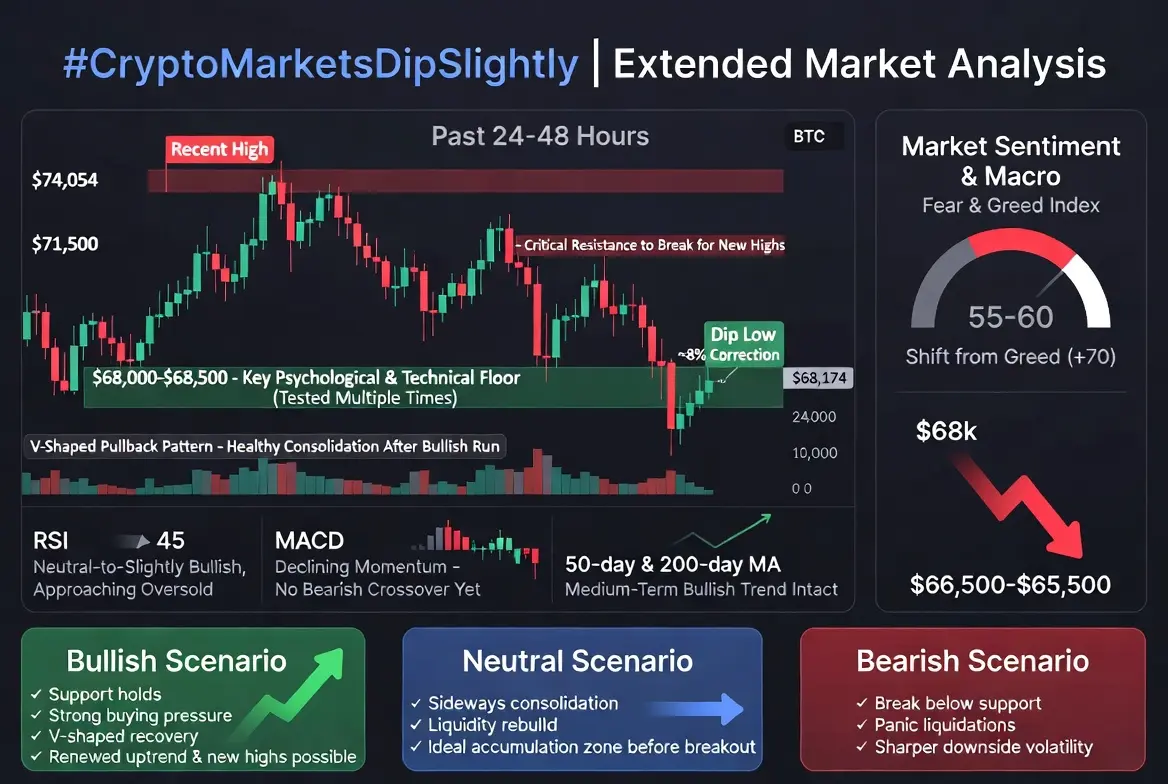
The cryptocurrency market has entered a phase of short-term retracement, with Bitcoin falling from $74,054 to $68,174, representing a ~8% correction from its recent high. While some may interpret this as bearish, a deeper look at the price structure, technical levels, and market behavior shows that this is likely a healthy consolidation rather than the start of a prolonged downtrend. Corrections of this magnitude are common after strong bullish moves, as traders take profits, reposition, and allow liquidity to rebuild at lower levels.
The price movement displays a V-shaped pullback, a pattern often seen when the market corrects quickly but maintains an overall upward trajectory. In such patterns, the rapid drop is usually followed by strong buying pressure near key support zones, as traders and investors view dips as accumulation opportunities. The current support around $68,000–$68,500 has been tested multiple times over the past 24 hours, and the rebound attempts indicate that buyers are stepping in to defend this level. This is a key psychological and technical floor, and sustaining it will likely determine the next directional move for Bitcoin and the broader crypto market.
From a technical perspective, short-term indicators suggest a neutral-to-slightly-bullish setup. The RSI is near 45, indicating the market is approaching oversold conditions, which historically attracts buyers. MACD shows declining bullish momentum, but no bearish crossover has occurred yet, suggesting the market may pause before resuming its previous uptrend. Moving averages, particularly the 50-day and 200-day MA, remain upward-sloping, reinforcing the medium-term bullish trend.
Resistance levels at $71,500 and $74,000 will be important to watch, as clearing these zones convincingly would signal renewed bullish strength and the potential for new highs.
Market liquidity also plays a crucial role in this correction. Spot trading volumes increased during the dip, a sign that accumulation is occurring at lower prices. Futures markets saw minor liquidations of long positions, which accelerated the pullback temporarily. However, open interest has remained stable, suggesting traders are not panicking but positioning themselves for the next major move. This combination of volume and open interest indicates a healthy market structure where volatility is temporary and functional, rather than a sign of systemic weakness.
Macro factors have also influenced this short-term pullback. Global geopolitical uncertainties, along with speculation regarding Federal Reserve policy decisions, have added caution to risk-on assets. Traders are monitoring potential rate changes and liquidity adjustments closely, as hawkish signals could push crypto lower, while dovish cues may trigger rapid rebounds. Importantly, there is no fundamental negative news causing this dip; it is largely technical and sentiment-driven, reflecting natural market rhythms after extended upward movements.
From a sentiment and psychology standpoint, the market has shifted from greed (~70) to a neutral fear/greed level (~55–60), showing that traders are cautious and waiting for confirmation before entering new positions. Short-term traders may avoid buying until Bitcoin stabilizes above $70,000, while long-term holders see this correction as a prime accumulation opportunity. The psychological zones of $68,000 (support) and $74,000 (resistance) now define the market’s near-term battleground. The behavior of these zones will be critical in determining whether the market rebounds quickly or experiences a deeper retracement.
Considering probable market scenarios, three paths emerge:
Bullish Scenario: If support at $68,000 holds, Bitcoin may bounce to retest $71,500 and potentially reach $74,000 again. This would confirm the V-shaped recovery pattern and reinforce the medium-term uptrend. Buyers accumulating during this correction would likely push momentum higher, attracting both short-term and long-term traders.
Bearish Scenario: If Bitcoin breaks below $68,000, the next support around $66,500–$65,500 will be tested. Such a move could trigger panic selling, particularly in leveraged positions, leading to sharper drops across altcoins and further short-term volatility. Traders need to manage risk carefully in this scenario, as over-leveraging could amplify losses.
Neutral Scenario: Bitcoin may consolidate between $68,000 and $71,500, trading sideways as the market digests recent gains and waits for a new catalyst. This phase allows liquidity to rebuild and can create an ideal environment for accumulation before a potential breakout. Traders should expect intraday volatility but a stable overall structure.
Strategic takeaways for traders include focusing on risk-adjusted entries near support, avoiding excessive leverage, and monitoring macro and technical signals for the next directional cue. Partial profit-taking near resistance zones ensures capital protection, while accumulation during dips can position traders to benefit from the next upward move. Short-term volatility should not be confused with trend reversal; instead, it represents a natural market rhythm that allows smart traders to optimize positions.
The dip from $74,054 to $68,174 represents a natural market correction in an overall bullish structure. Support at $68,000 is critical for sustaining upward momentum, while resistance at $71,500–$74,000 will test the market’s strength in the near term. Market behavior, technical indicators, liquidity, and sentiment all point to a V-shaped rebound potential, though a breakdown below $68,000 could open the door to further short-term downside. Traders should monitor these zones closely, maintain disciplined risk management, and prepare for either a rebound or deeper consolidation, as the market is at a decision point that will define the next major directional move.