Trade
Basic
Futures
Futures
Hundreds of contracts settled in USDT or BTC
TradFi
Gold
Trade global traditional assets with USDT in one place
Options
Hot
Trade European-style vanilla options
Unified Account
Maximize your capital efficiency
Demo Trading
Futures Kickoff
Get prepared for your futures trading
Futures Events
Participate in events to win generous rewards
Demo Trading
Use virtual funds to experience risk-free trading
Earn
Launch
CandyDrop
Collect candies to earn airdrops
Launchpool
Quick staking, earn potential new tokens
HODLer Airdrop
Hold GT and get massive airdrops for free
Launchpad
Be early to the next big token project
Alpha Points
Trade on-chain assets and enjoy airdrop rewards!
Futures Points
Earn futures points and claim airdrop rewards
Investment
Simple Earn
Earn interests with idle tokens
Auto-Invest
Auto-invest on a regular basis
Dual Investment
Buy low and sell high to take profits from price fluctuations
Soft Staking
Earn rewards with flexible staking
Crypto Loan
0 Fees
Pledge one crypto to borrow another
Lending Center
One-stop lending hub
VIP Wealth Hub
Customized wealth management empowers your assets growth
Private Wealth Management
Customized asset management to grow your digital assets
Quant Fund
Top asset management team helps you profit without hassle
Staking
Stake cryptos to earn in PoS products
Smart Leverage
New
No forced liquidation before maturity, worry-free leveraged gains
GUSD Minting
Use USDT/USDC to mint GUSD for treasury-level yields
More
# TripleBottom
480
Lions_Lionish
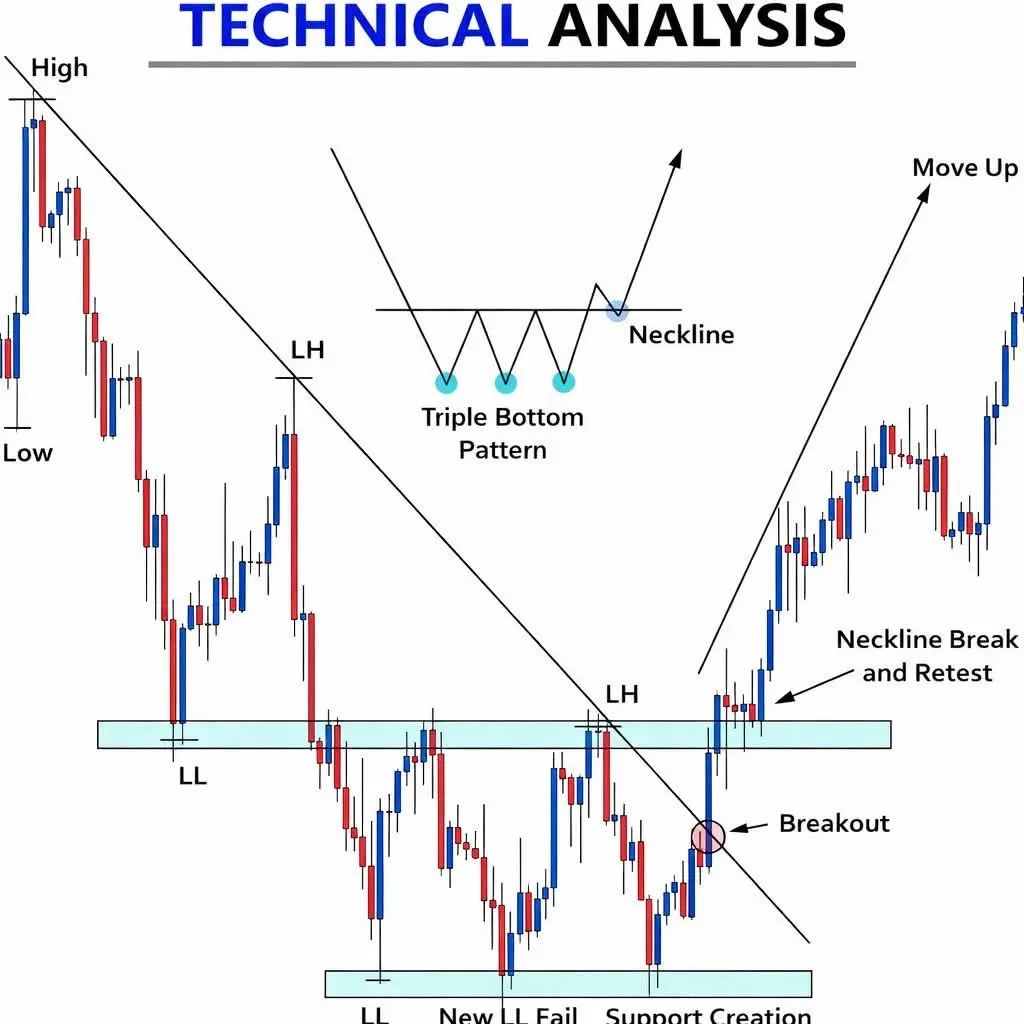
📊 TECHNICAL ANALYSIS MADE SIMPLE
This chart shows a Triple Bottom pattern — one of the strongest trend reversal signals in trading.
🔹 Price makes three equal lows
🔹 Sellers lose strength (New LL fails)
🔹 Neckline breaks with momentum
🔹 Retest confirms the breakout
🔹 Trend shifts from bearish → bullish 🚀
Smart traders wait for confirmation, not emotions.
Discipline + structure = consistency in trading 💡
📈 Trade the pattern, not the noise.
👍 Like | 💬 Comment | 🔁 Share
Follow for more simple & powerful trading education
$BTC $ETH $SOL
#TechnicalAnalysis #TripleBottom #PriceAction #Sm
- Reward
- like
- Comment
- Repost
- Share
Load More
Join 40M users in our growing community
⚡️ Join 40M users in the crypto craze discussion
💬 Engage with your favorite top creators
👍 See what interests you
Trending Topics
218.14K Popularity
30.37K Popularity
13.52K Popularity
13.27K Popularity
6.43K Popularity
74.14K Popularity
4.74K Popularity
6.43K Popularity
6.16K Popularity
3.18K Popularity
3.86K Popularity
13.69K Popularity
3.6K Popularity
20.12K Popularity
11.07K Popularity
News
View MoreGray Scale Report: Bitcoin Price Trends Are in Sync with Technology Stocks, Not Gold
6 m
Data: 1,596,700 TON transferred from an anonymous address, then routed through intermediaries into TON
11 m
Google Warning: North Korean Hackers Use AI Technology and Fake Zoom Meetings to Launch Malicious Attacks on the Crypto Sector
11 m
Institutions Drive RWA Tokenization Boom, Retail Investors May Face Participation Window
18 m
The U.S. House of Representatives narrowly rejected the motion, allowing the Trump tariff resolution to be brought to the full chamber for a vote.
18 m
Pin