


#WCTCTradingKingPK
Advanced Multi-Timeframe Momentum Strategy for WCTC S8 Individual PK Competition
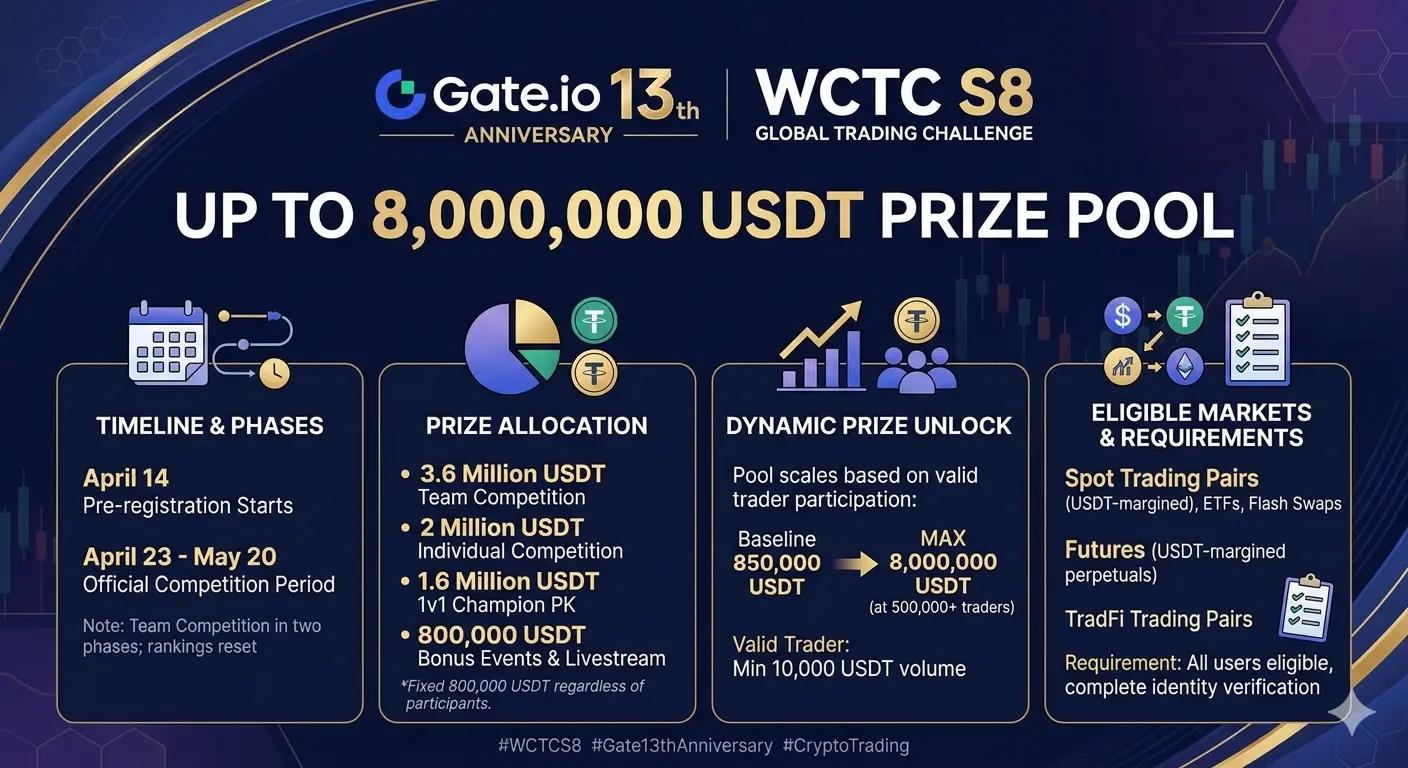
The Individual PK Competition in WCTC S8 demands a trading approach that balances aggressive return generation with disciplined risk management. This comprehensive strategy guide presents a multi-timeframe momentum system specifically optimized for the high-pressure environment of head-to-head trading battles where performance is measured over compressed time periods.
Core Strategy Philosophy
The foundation of this strategy rests on capturing explosive price movements while maintaining strict capital preservation protocols. Unlike traditional swing trading that might hold positions for days or weeks, PK competition trading requires rapid decision-making and quick profit realization. The strategy employs a three-layer confirmation system that filters noise and identifies high-probability momentum bursts across multiple timeframes.
Timeframe Architecture
The strategy utilizes four distinct timeframes working in concert. The monthly and weekly charts provide structural context for major support and resistance zones. The daily chart identifies the primary trend direction and key decision levels. The four-hour chart serves as the main execution timeframe where entry and exit signals are generated. Finally, the one-hour chart provides micro-structure for precise entry timing and stop-loss placement.
This multi-timeframe approach ensures that trades align with the broader market structure while allowing for tactical precision in execution. Trading against the higher timeframe trend significantly reduces win probability, so the strategy enforces strict trend alignment rules before any position is considered.
Technical Indicator Configuration
The primary momentum identification tool combines the Relative Strength Index with volume analysis. The RSI is configured with a 14-period setting on the four-hour chart, with overbought and oversold thresholds adjusted to 75 and 25 respectively to account for cryptocurrency market volatility. Volume confirmation requires the current candle to exceed the 20-period average volume by at least fifty percent, ensuring that momentum signals coincide with genuine market participation rather than low-liquidity noise.
A secondary confirmation layer employs the Moving Average Convergence Divergence indicator with standard 12, 26, and 9 period settings. The strategy requires MACD histogram alignment with price momentum, meaning that bullish entries only trigger when both price and MACD histogram are making higher lows, while bearish entries require both to make lower highs.
The third confirmation element tracks exponential moving averages with 20, 50, and 200 period settings. The strategy mandates that price action must respect the 20-period EMA as dynamic support in uptrends and resistance in downtrends. Entries are only permitted when price pulls back to test the 20 EMA and demonstrates rejection through candlestick patterns.
Entry Protocol
Long entries trigger when four conditions align simultaneously. First, the daily chart must show a clearly defined uptrend with higher highs and higher lows. Second, the four-hour RSI must pullback from overbought territory to the 40-50 zone, indicating a healthy correction within the trend. Third, the MACD histogram must show bullish divergence or flattening before resuming upward expansion. Fourth, price must touch or slightly pierce the 20-period EMA on the four-hour chart and form a reversal candlestick pattern such as a hammer, morning star, or bullish engulfing.
Short entries follow the inverse logic with corresponding bearish requirements. The daily trend must be downward, the four-hour RSI must bounce from oversold to the 50-60 zone, MACD must show bearish characteristics, and price must reject from the 20 EMA with appropriate bearish candlestick confirmation.
Position Sizing and Risk Management
Capital allocation follows a dynamic position sizing model based on account equity and volatility conditions. The base position size starts at two percent of total trading capital per trade. This percentage increases to three percent when the Average True Range over fourteen periods falls below its 50-period average, indicating compressed volatility that often precedes explosive moves. Conversely, position size reduces to one percent when ATR exceeds its average by more than fifty percent, signaling elevated volatility and increased risk.
Stop-loss placement utilizes a dual-layer approach. The initial stop-loss sits at the swing low prior to entry for long positions or the swing high for short positions, ensuring that the trade invalidation point represents a genuine structural break rather than normal market noise. A secondary trailing stop activates once the position achieves a risk-to-reward ratio of one-to-one, locking in profits while allowing winners to run.
Profit Target Framework
The strategy employs a tiered profit-taking system designed to capture momentum while protecting gains. The first profit target sits at a one-point-five risk-to-reward ratio, where twenty-five percent of the position is closed. This initial partial exit ensures that the trade becomes risk-free while maintaining exposure to further gains. The second target at a two-point-five risk-to-reward ratio triggers closure of another fifty percent of the position. The final twenty-five percent trails with a stop-loss set at the second target level, capturing extended moves while protecting accumulated profits.
PK Competition Specific Adaptations
The Individual PK format introduces unique constraints that require strategic modifications. Competition rounds operate on fixed timeframes, typically ranging from hours to days, unlike normal trading where positions can be held indefinitely. This compressed timeline necessitates more aggressive entry criteria and faster profit realization.
The strategy adapts by reducing the confirmation period requirements. While standard implementation waits for daily candle closes, competition trading utilizes four-hour closes with one-hour micro-confirmation. This accelerates signal generation while maintaining structural validity.
Additionally, the PK environment benefits from correlation analysis across multiple trading pairs. When Bitcoin demonstrates strong momentum, altcoins often follow with amplified moves. The strategy monitors Bitcoin's four-hour structure as a leading indicator, entering altcoin positions only when Bitcoin confirms directional bias. This correlation filter significantly improves win rates by ensuring trades align with broad market sentiment.
Psychological Discipline Protocols
High-stakes competition trading amplifies emotional responses that destroy rational decision-making. The strategy incorporates specific protocols to maintain psychological equilibrium. Pre-session preparation includes reviewing trade rules, visualizing execution scenarios, and setting maximum daily loss limits at four percent of account equity. Once this limit triggers, all trading ceases regardless of market conditions or perceived opportunities.
During active trading, the strategy enforces a mandatory five-minute break after any losing trade. This cooling-off period prevents revenge trading and emotional escalation. Similarly, after three consecutive winning trades, a ten-minute break is required to prevent overconfidence and sloppy execution.
Market Condition Filters
Not all market environments support momentum trading effectively. The strategy identifies three distinct market regimes and adjusts accordingly. Trending markets with clear directional bias and healthy pullbacks represent ideal conditions where the strategy operates at full capacity. Choppy, range-bound markets with overlapping price action trigger a reduction in position size and wider stop-loss placement. Strongly trending markets with parabolic price action activate aggressive profit-taking and trailing stop protocols to protect against sudden reversals.
The Average Directional Index serves as the primary regime identification tool. Readings above thirty indicate trending conditions suitable for full strategy deployment. Readings between twenty and thirty suggest choppy conditions requiring caution. Readings below twenty signal ranging markets where the strategy remains inactive.
Execution Checklist
Every trade requires completion of a pre-entry checklist ensuring all conditions align. The checklist verifies trend alignment across timeframes, indicator confirmation, volume validation, risk-to-reward ratio minimum of one-to-two, and position size calculation. No trade proceeds without checklist completion, eliminating impulsive decisions and emotional overrides.
Post-trade analysis follows every closed position, documenting entry and exit rationale, emotional state, market conditions, and lessons learned. This continuous feedback loop drives strategy refinement and performance improvement over the competition period.
Advanced Techniques for Competitive Edge
Experienced traders can enhance the core strategy with additional techniques. Order flow analysis through volume profile identifies high-probability reaction zones where institutional participation concentrates. Market structure analysis tracks break of structure and change of character patterns that signal trend continuation or reversal. Multiple timeframe confluence zones where daily, four-hour, and one-hour support or resistance align provide exceptional risk-to-reward opportunities.
Correlation arbitrage between spot and perpetual futures markets occasionally presents risk-free profit opportunities during funding rate anomalies. While these situations are rare, monitoring funding rates every eight hours can capture additional returns without directional risk.
Performance Expectations and Reality
Successful implementation of this strategy in PK competition environments typically produces win rates between forty-five and fifty-five percent. While this appears modest, the asymmetric risk-to-reward structure ensures profitability. Average wins should exceed average losses by a factor of two to one or greater. This mathematical edge, compounded over multiple trades, generates the returns necessary for competitive performance.
Traders must abandon the pursuit of perfect trades and high win rates. Consistency, discipline, and adherence to proven mathematical edges outperform intuitive genius over time. The strategy provides the framework, but execution discipline determines ultimate success.
Final Implementation Notes
This strategy represents a complete trading system, not a collection of isolated indicators. Successful implementation requires thorough backtesting on historical data, paper trading to verify execution capability, and gradual capital deployment as proficiency develops. Modifying individual elements without understanding their systemic relationships typically degrades performance rather than improving it.
The WCTC S8 Individual PK Competition rewards traders who combine technical skill with psychological resilience. This strategy provides the technical foundation, but consistent application under pressure separates winners from participants. Master the system, trust the process, and let probability work in your favor over the competition timeline.
Advanced Multi-Timeframe Momentum Strategy for WCTC S8 Individual PK Competition
The Individual PK Competition in WCTC S8 demands a trading approach that balances aggressive return generation with disciplined risk management. This comprehensive strategy guide presents a multi-timeframe momentum system specifically optimized for the high-pressure environment of head-to-head trading battles where performance is measured over compressed time periods.
Core Strategy Philosophy
The foundation of this strategy rests on capturing explosive price movements while maintaining strict capital preservation protocols. Unlike traditional swing trading that might hold positions for days or weeks, PK competition trading requires rapid decision-making and quick profit realization. The strategy employs a three-layer confirmation system that filters noise and identifies high-probability momentum bursts across multiple timeframes.
Timeframe Architecture
The strategy utilizes four distinct timeframes working in concert. The monthly and weekly charts provide structural context for major support and resistance zones. The daily chart identifies the primary trend direction and key decision levels. The four-hour chart serves as the main execution timeframe where entry and exit signals are generated. Finally, the one-hour chart provides micro-structure for precise entry timing and stop-loss placement.
This multi-timeframe approach ensures that trades align with the broader market structure while allowing for tactical precision in execution. Trading against the higher timeframe trend significantly reduces win probability, so the strategy enforces strict trend alignment rules before any position is considered.
Technical Indicator Configuration
The primary momentum identification tool combines the Relative Strength Index with volume analysis. The RSI is configured with a 14-period setting on the four-hour chart, with overbought and oversold thresholds adjusted to 75 and 25 respectively to account for cryptocurrency market volatility. Volume confirmation requires the current candle to exceed the 20-period average volume by at least fifty percent, ensuring that momentum signals coincide with genuine market participation rather than low-liquidity noise.
A secondary confirmation layer employs the Moving Average Convergence Divergence indicator with standard 12, 26, and 9 period settings. The strategy requires MACD histogram alignment with price momentum, meaning that bullish entries only trigger when both price and MACD histogram are making higher lows, while bearish entries require both to make lower highs.
The third confirmation element tracks exponential moving averages with 20, 50, and 200 period settings. The strategy mandates that price action must respect the 20-period EMA as dynamic support in uptrends and resistance in downtrends. Entries are only permitted when price pulls back to test the 20 EMA and demonstrates rejection through candlestick patterns.
Entry Protocol
Long entries trigger when four conditions align simultaneously. First, the daily chart must show a clearly defined uptrend with higher highs and higher lows. Second, the four-hour RSI must pullback from overbought territory to the 40-50 zone, indicating a healthy correction within the trend. Third, the MACD histogram must show bullish divergence or flattening before resuming upward expansion. Fourth, price must touch or slightly pierce the 20-period EMA on the four-hour chart and form a reversal candlestick pattern such as a hammer, morning star, or bullish engulfing.
Short entries follow the inverse logic with corresponding bearish requirements. The daily trend must be downward, the four-hour RSI must bounce from oversold to the 50-60 zone, MACD must show bearish characteristics, and price must reject from the 20 EMA with appropriate bearish candlestick confirmation.
Position Sizing and Risk Management
Capital allocation follows a dynamic position sizing model based on account equity and volatility conditions. The base position size starts at two percent of total trading capital per trade. This percentage increases to three percent when the Average True Range over fourteen periods falls below its 50-period average, indicating compressed volatility that often precedes explosive moves. Conversely, position size reduces to one percent when ATR exceeds its average by more than fifty percent, signaling elevated volatility and increased risk.
Stop-loss placement utilizes a dual-layer approach. The initial stop-loss sits at the swing low prior to entry for long positions or the swing high for short positions, ensuring that the trade invalidation point represents a genuine structural break rather than normal market noise. A secondary trailing stop activates once the position achieves a risk-to-reward ratio of one-to-one, locking in profits while allowing winners to run.
Profit Target Framework
The strategy employs a tiered profit-taking system designed to capture momentum while protecting gains. The first profit target sits at a one-point-five risk-to-reward ratio, where twenty-five percent of the position is closed. This initial partial exit ensures that the trade becomes risk-free while maintaining exposure to further gains. The second target at a two-point-five risk-to-reward ratio triggers closure of another fifty percent of the position. The final twenty-five percent trails with a stop-loss set at the second target level, capturing extended moves while protecting accumulated profits.
PK Competition Specific Adaptations
The Individual PK format introduces unique constraints that require strategic modifications. Competition rounds operate on fixed timeframes, typically ranging from hours to days, unlike normal trading where positions can be held indefinitely. This compressed timeline necessitates more aggressive entry criteria and faster profit realization.
The strategy adapts by reducing the confirmation period requirements. While standard implementation waits for daily candle closes, competition trading utilizes four-hour closes with one-hour micro-confirmation. This accelerates signal generation while maintaining structural validity.
Additionally, the PK environment benefits from correlation analysis across multiple trading pairs. When Bitcoin demonstrates strong momentum, altcoins often follow with amplified moves. The strategy monitors Bitcoin's four-hour structure as a leading indicator, entering altcoin positions only when Bitcoin confirms directional bias. This correlation filter significantly improves win rates by ensuring trades align with broad market sentiment.
Psychological Discipline Protocols
High-stakes competition trading amplifies emotional responses that destroy rational decision-making. The strategy incorporates specific protocols to maintain psychological equilibrium. Pre-session preparation includes reviewing trade rules, visualizing execution scenarios, and setting maximum daily loss limits at four percent of account equity. Once this limit triggers, all trading ceases regardless of market conditions or perceived opportunities.
During active trading, the strategy enforces a mandatory five-minute break after any losing trade. This cooling-off period prevents revenge trading and emotional escalation. Similarly, after three consecutive winning trades, a ten-minute break is required to prevent overconfidence and sloppy execution.
Market Condition Filters
Not all market environments support momentum trading effectively. The strategy identifies three distinct market regimes and adjusts accordingly. Trending markets with clear directional bias and healthy pullbacks represent ideal conditions where the strategy operates at full capacity. Choppy, range-bound markets with overlapping price action trigger a reduction in position size and wider stop-loss placement. Strongly trending markets with parabolic price action activate aggressive profit-taking and trailing stop protocols to protect against sudden reversals.
The Average Directional Index serves as the primary regime identification tool. Readings above thirty indicate trending conditions suitable for full strategy deployment. Readings between twenty and thirty suggest choppy conditions requiring caution. Readings below twenty signal ranging markets where the strategy remains inactive.
Execution Checklist
Every trade requires completion of a pre-entry checklist ensuring all conditions align. The checklist verifies trend alignment across timeframes, indicator confirmation, volume validation, risk-to-reward ratio minimum of one-to-two, and position size calculation. No trade proceeds without checklist completion, eliminating impulsive decisions and emotional overrides.
Post-trade analysis follows every closed position, documenting entry and exit rationale, emotional state, market conditions, and lessons learned. This continuous feedback loop drives strategy refinement and performance improvement over the competition period.
Advanced Techniques for Competitive Edge
Experienced traders can enhance the core strategy with additional techniques. Order flow analysis through volume profile identifies high-probability reaction zones where institutional participation concentrates. Market structure analysis tracks break of structure and change of character patterns that signal trend continuation or reversal. Multiple timeframe confluence zones where daily, four-hour, and one-hour support or resistance align provide exceptional risk-to-reward opportunities.
Correlation arbitrage between spot and perpetual futures markets occasionally presents risk-free profit opportunities during funding rate anomalies. While these situations are rare, monitoring funding rates every eight hours can capture additional returns without directional risk.
Performance Expectations and Reality
Successful implementation of this strategy in PK competition environments typically produces win rates between forty-five and fifty-five percent. While this appears modest, the asymmetric risk-to-reward structure ensures profitability. Average wins should exceed average losses by a factor of two to one or greater. This mathematical edge, compounded over multiple trades, generates the returns necessary for competitive performance.
Traders must abandon the pursuit of perfect trades and high win rates. Consistency, discipline, and adherence to proven mathematical edges outperform intuitive genius over time. The strategy provides the framework, but execution discipline determines ultimate success.
Final Implementation Notes
This strategy represents a complete trading system, not a collection of isolated indicators. Successful implementation requires thorough backtesting on historical data, paper trading to verify execution capability, and gradual capital deployment as proficiency develops. Modifying individual elements without understanding their systemic relationships typically degrades performance rather than improving it.
The WCTC S8 Individual PK Competition rewards traders who combine technical skill with psychological resilience. This strategy provides the technical foundation, but consistent application under pressure separates winners from participants. Master the system, trust the process, and let probability work in your favor over the competition timeline.