💰
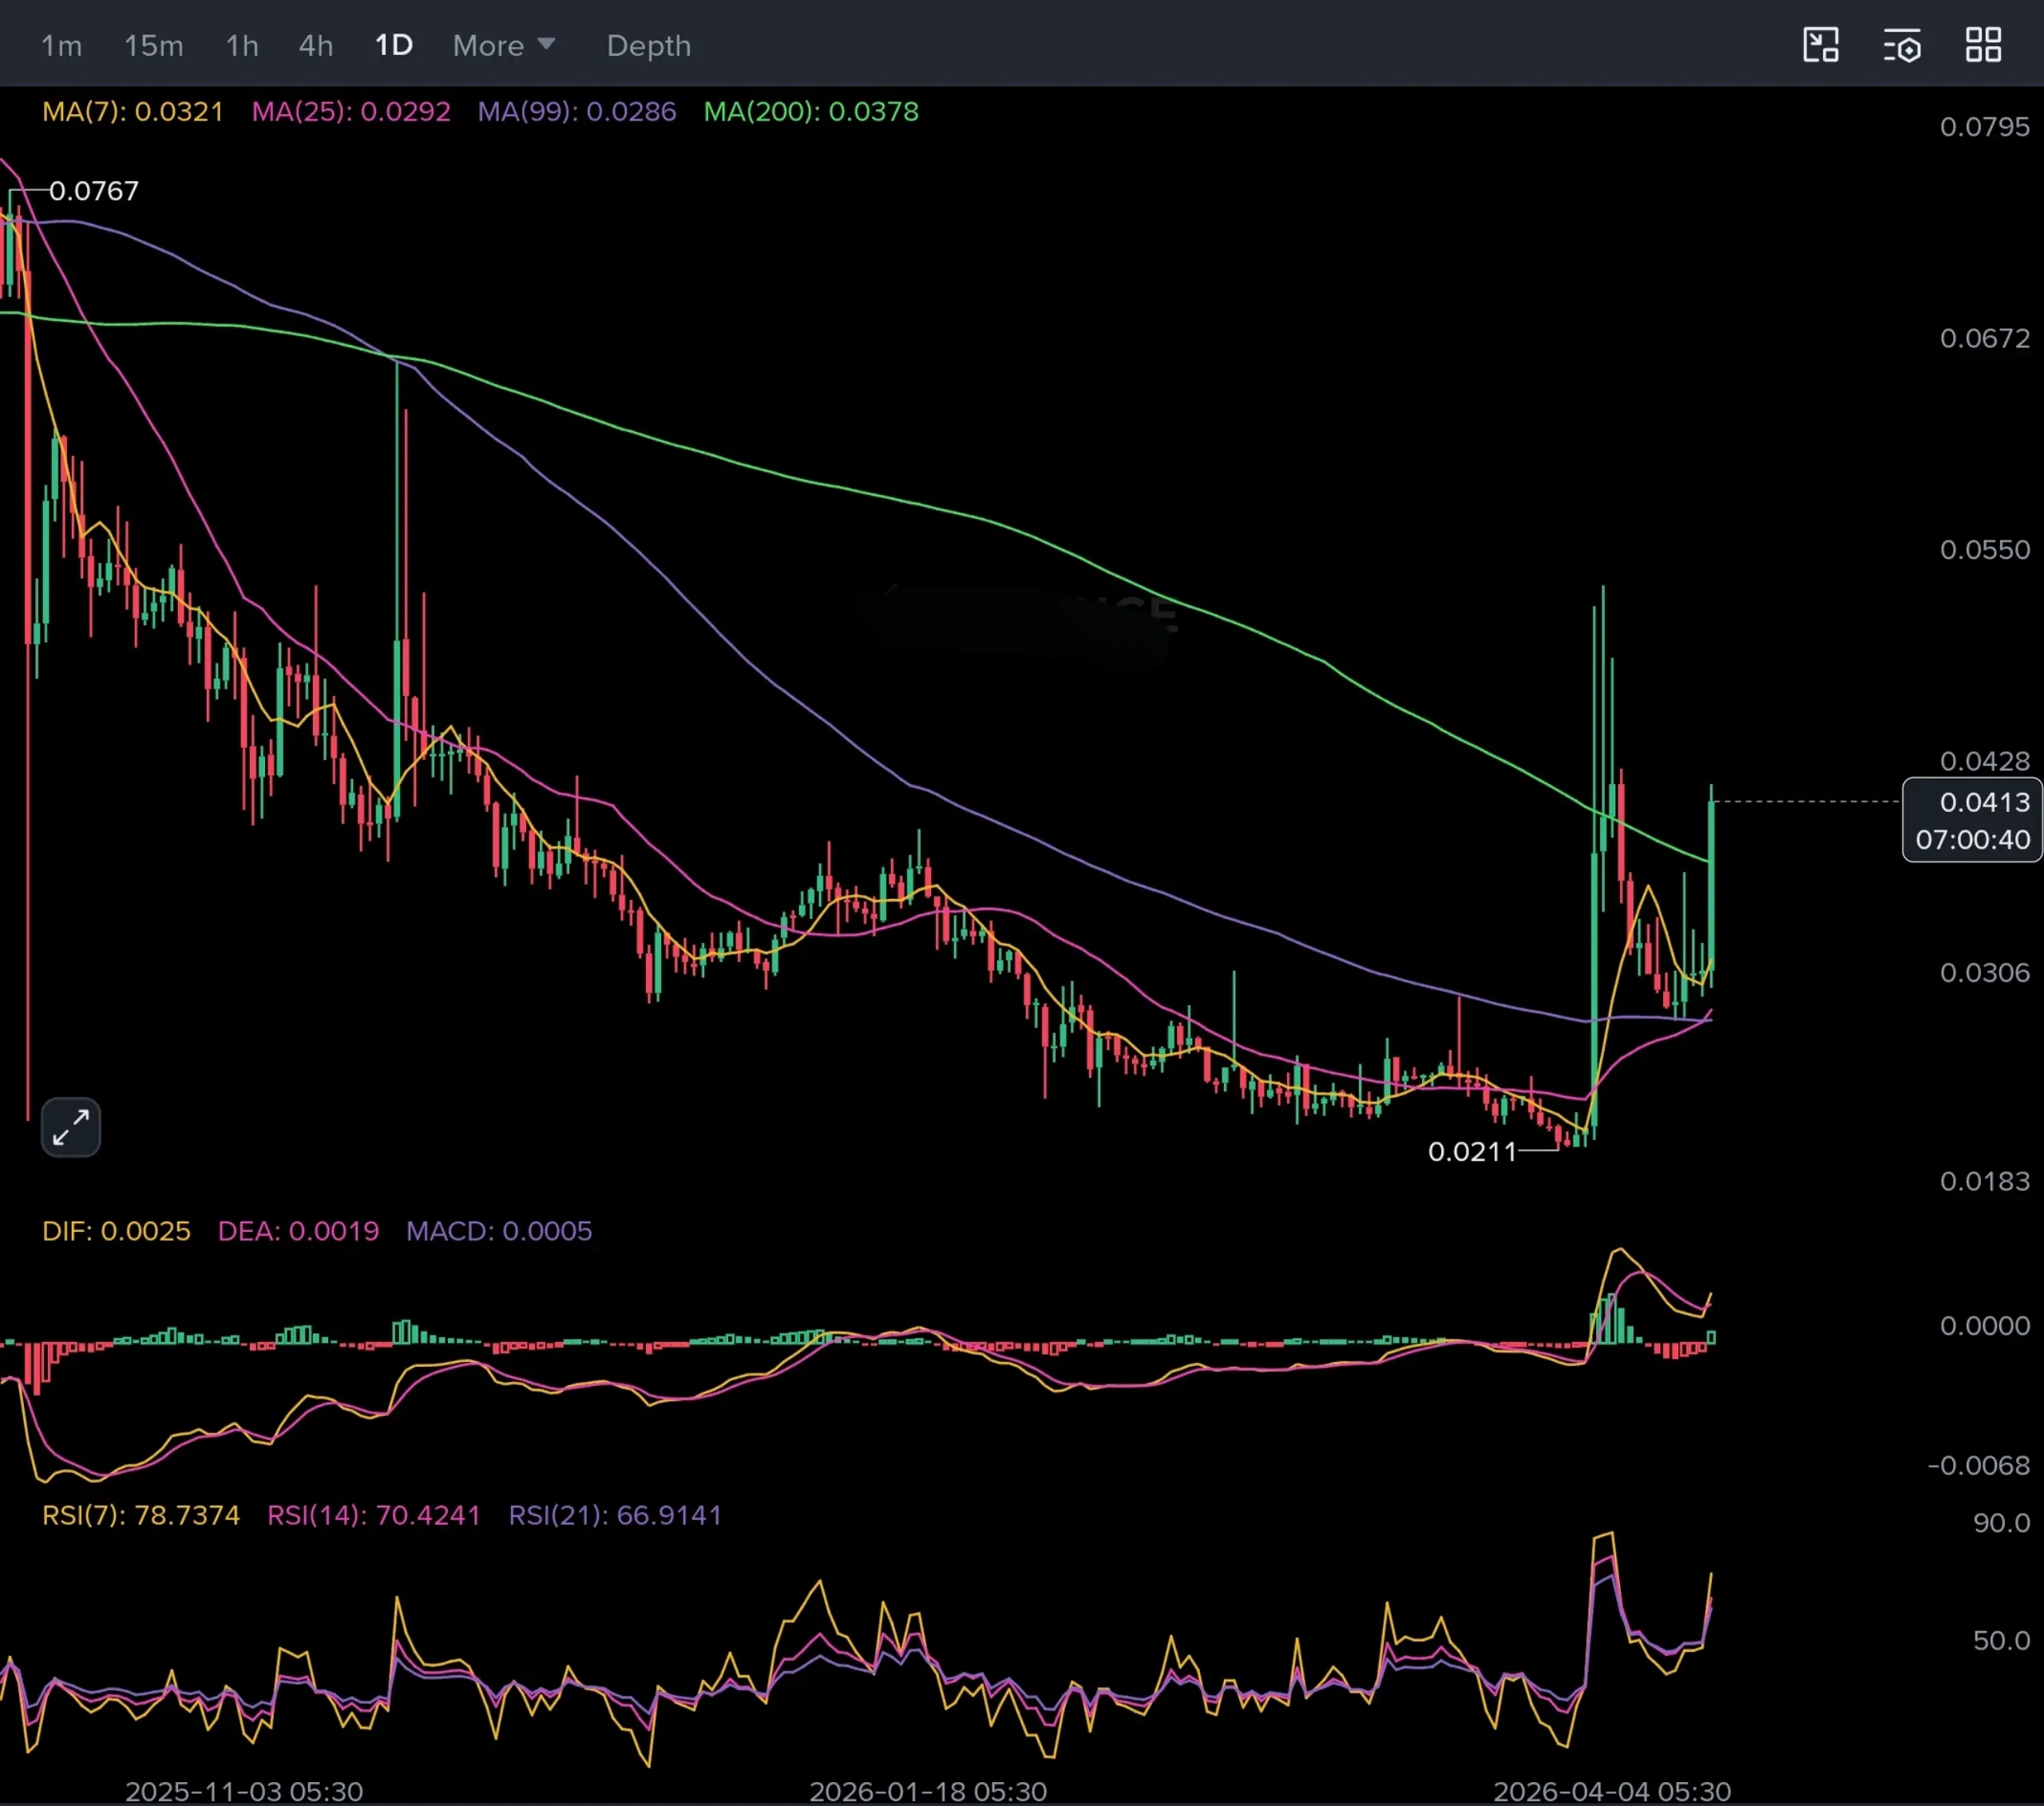
$BASED – Reversal Brewing After Long Downtrend
🔼 LONG
✳️ ENTRY : 0.0770 - 0.0740 - 0.0720
🎯 TARGETS: 0.07980, 0.081950, 0.0850, 0.091150, 0.10250, 0.12400, 0.1500
🀄️ LEVERAGE: 20x
🔴 STOPLOSS: 0.0720
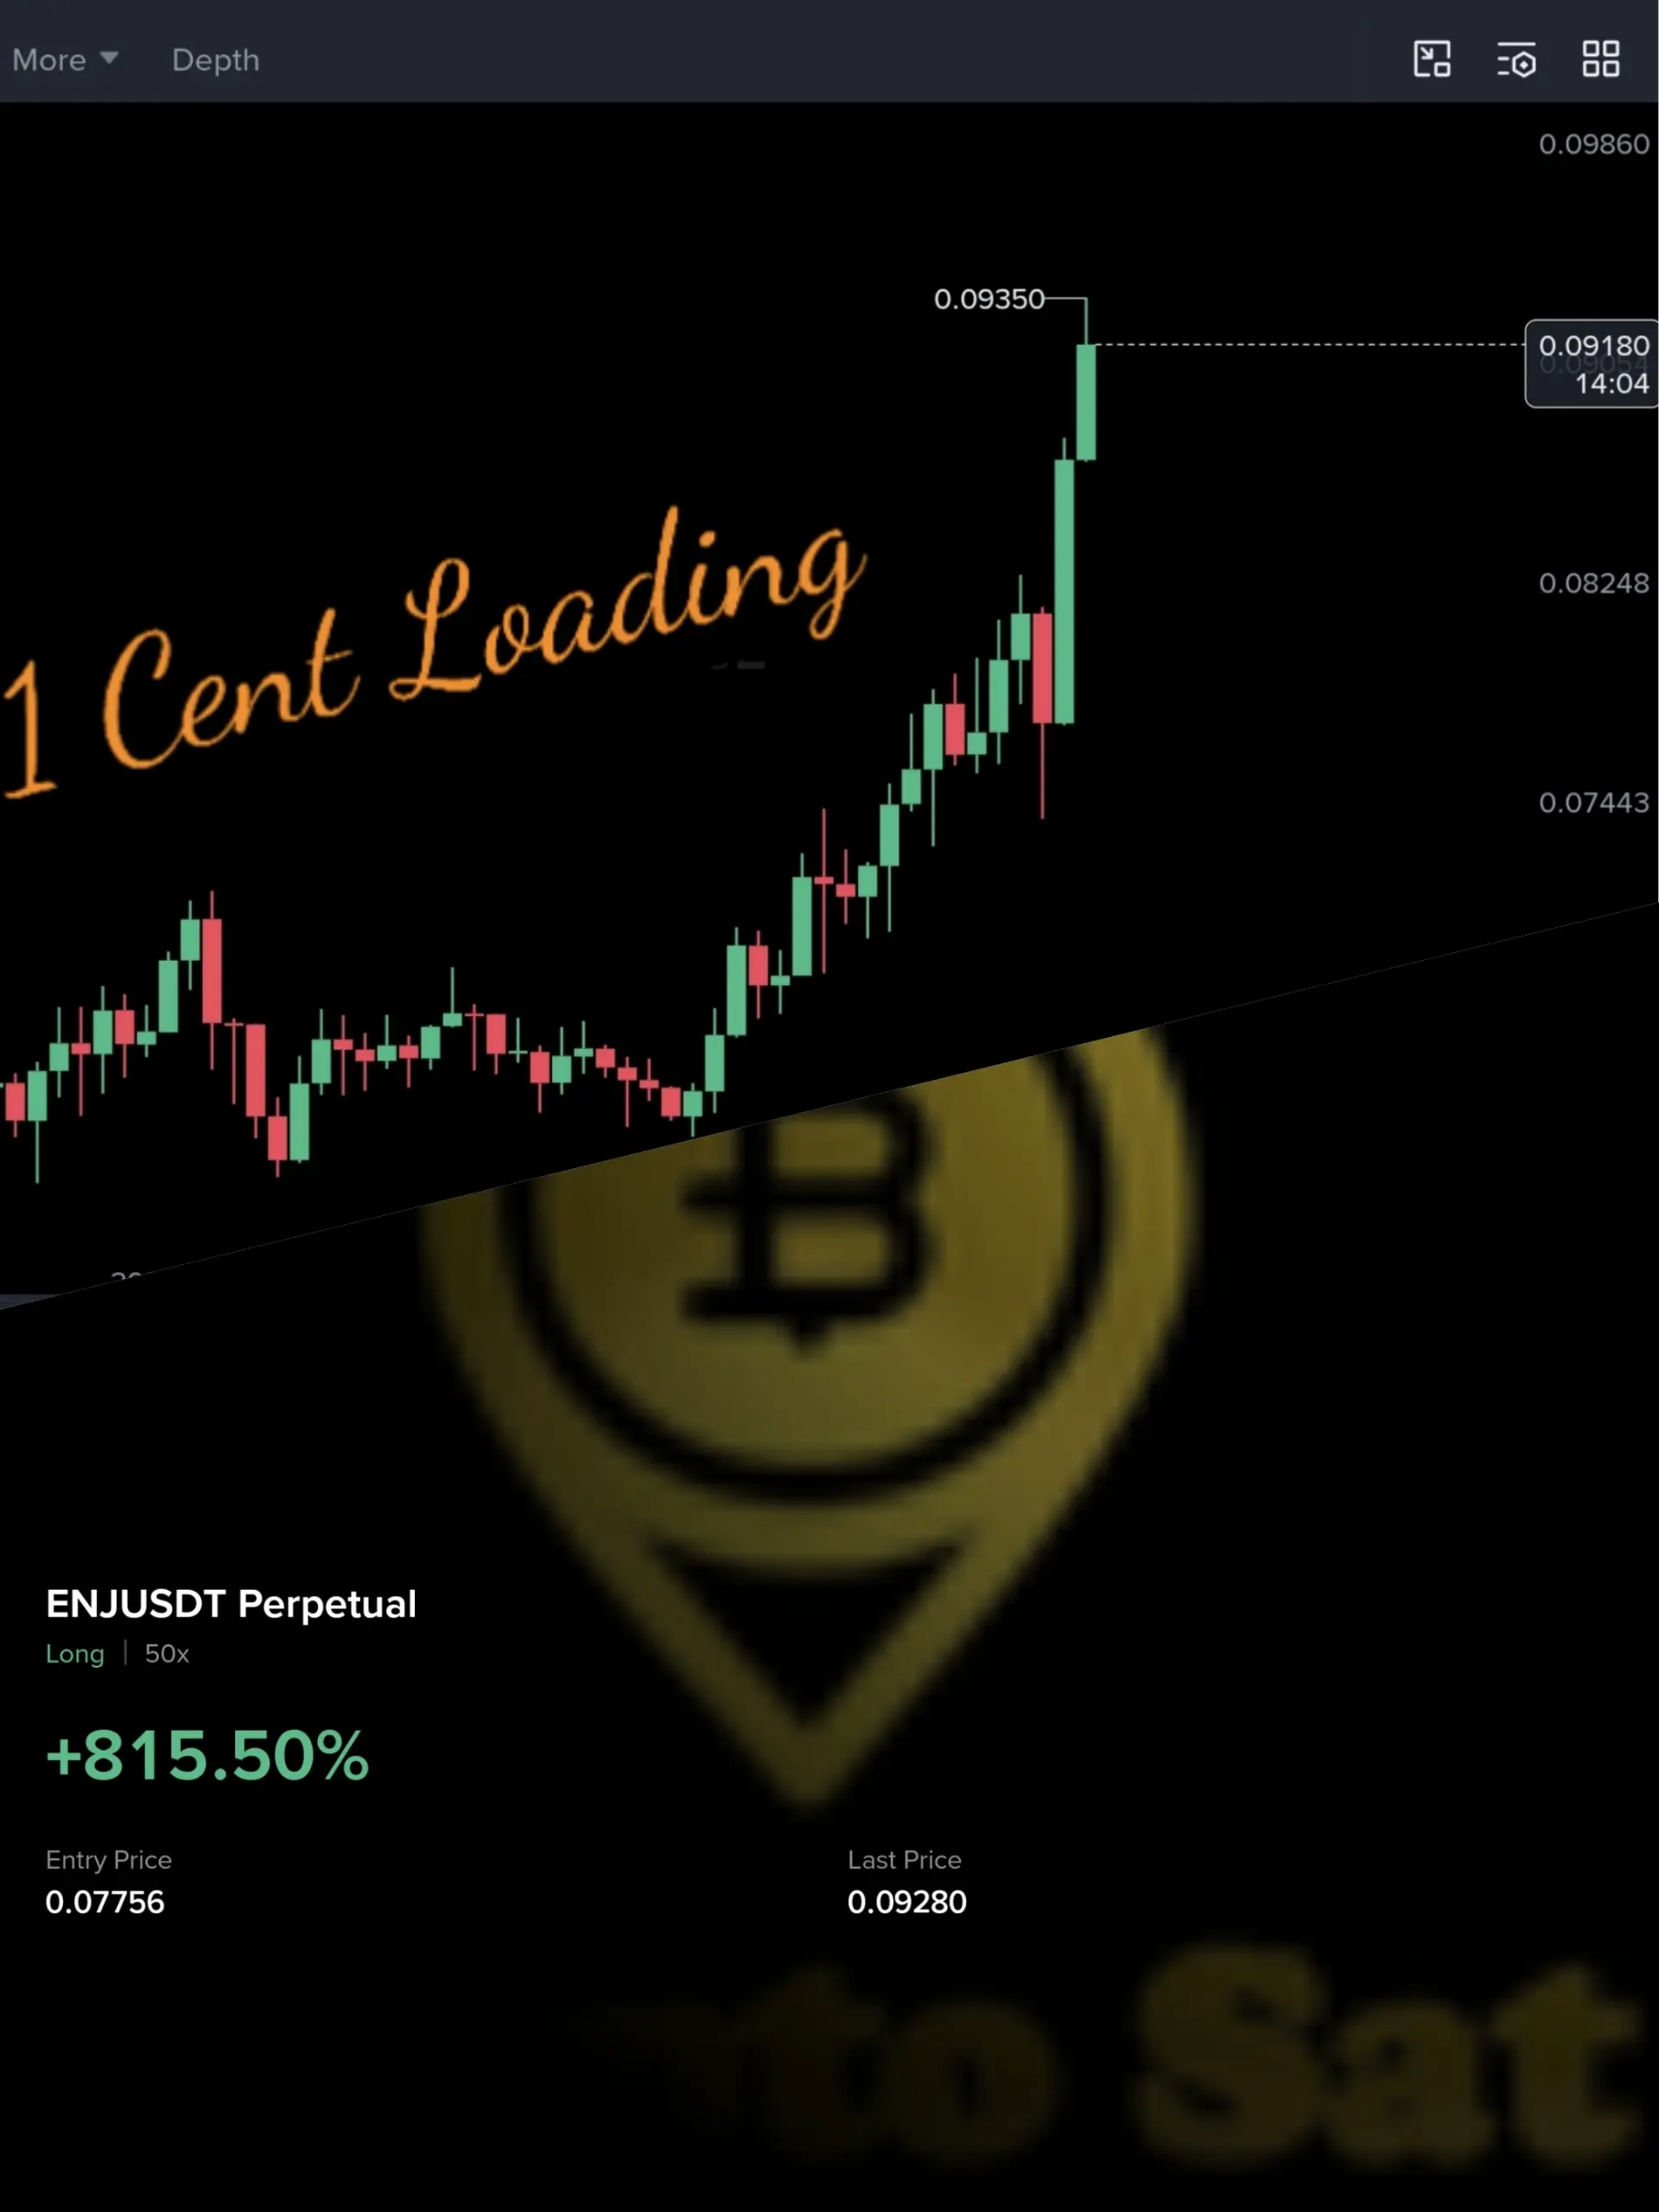
After a prolonged downtrend, price is finally showing signs of base formation near 0.049 zone and now pushing upward with strength 📈
MA7 has crossed above MA25, indicating early bullish momentum, while higher lows confirm buyers are stepping in.
Current move looks like a trend reversal + accumulation breakout, not just a dead cat bounce.
DCA entries near support can give a safer position, but SL must be respected if structure fails.
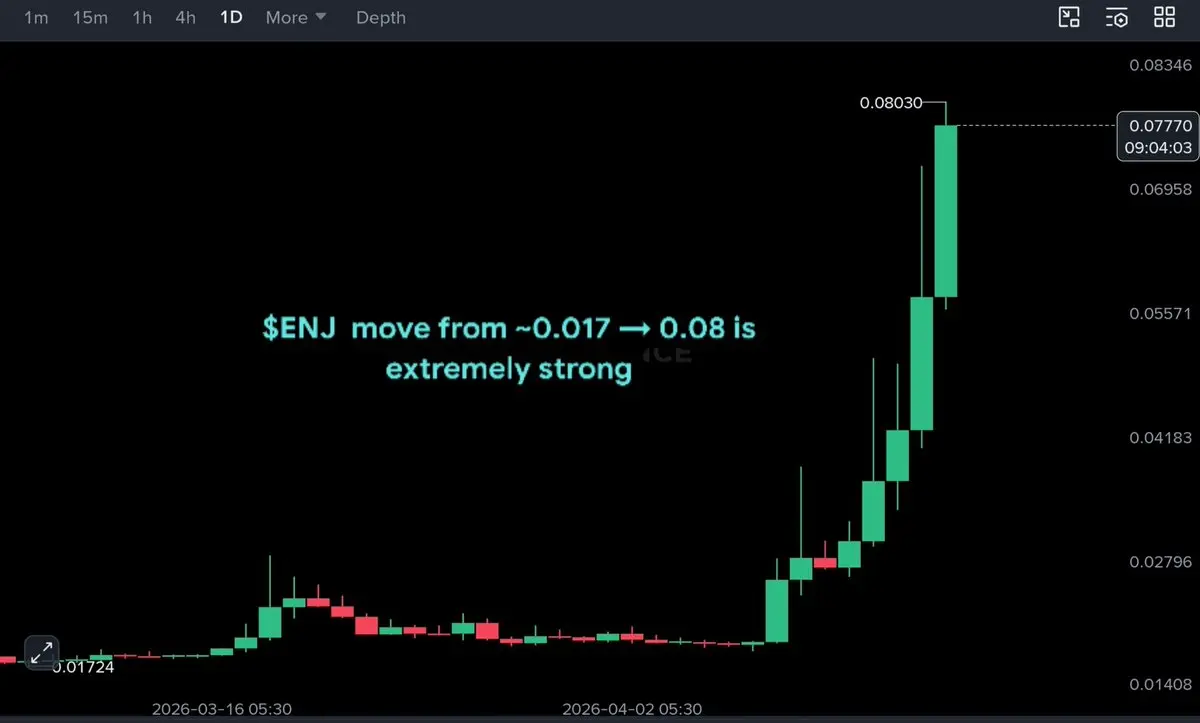
If momentum continues, this setup has strong potential to expand towards 0.12 – 0.15 liquidity zone 🚀