LeleMakesAFortune
Determining the top or bottom of Virtual Money requires a comprehensive analysis combining technical indicators, on-chain data, market sentiment, and cyclical patterns. Here are the key methods and practical applications:
📊 1. technical indicator
Trading Volume and Open Interest
Top Signal:
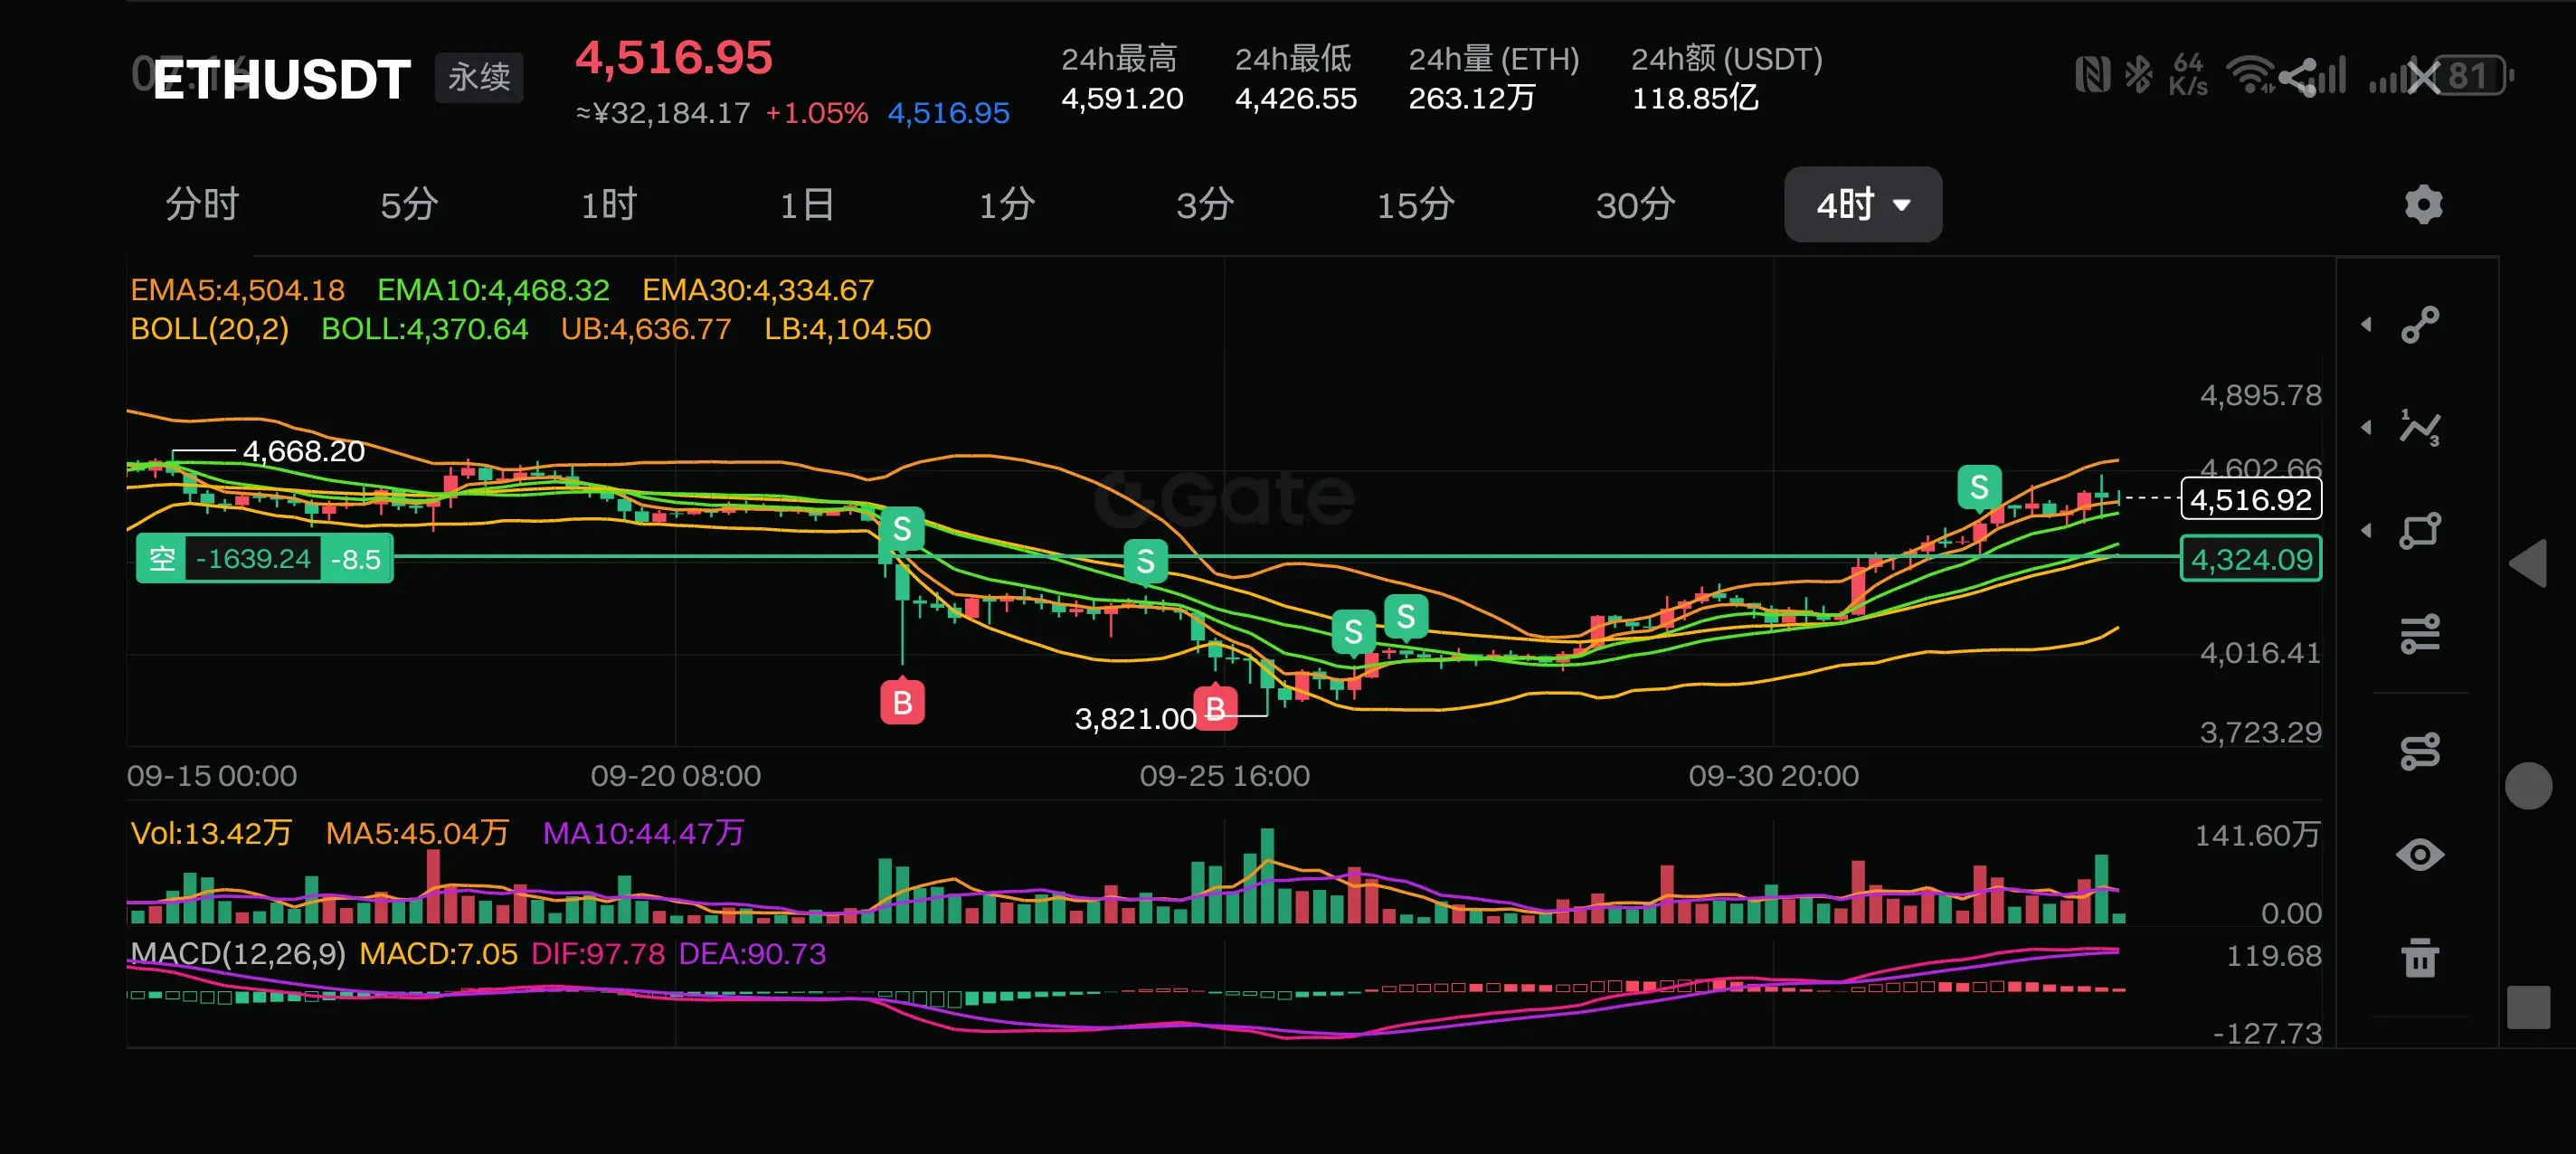
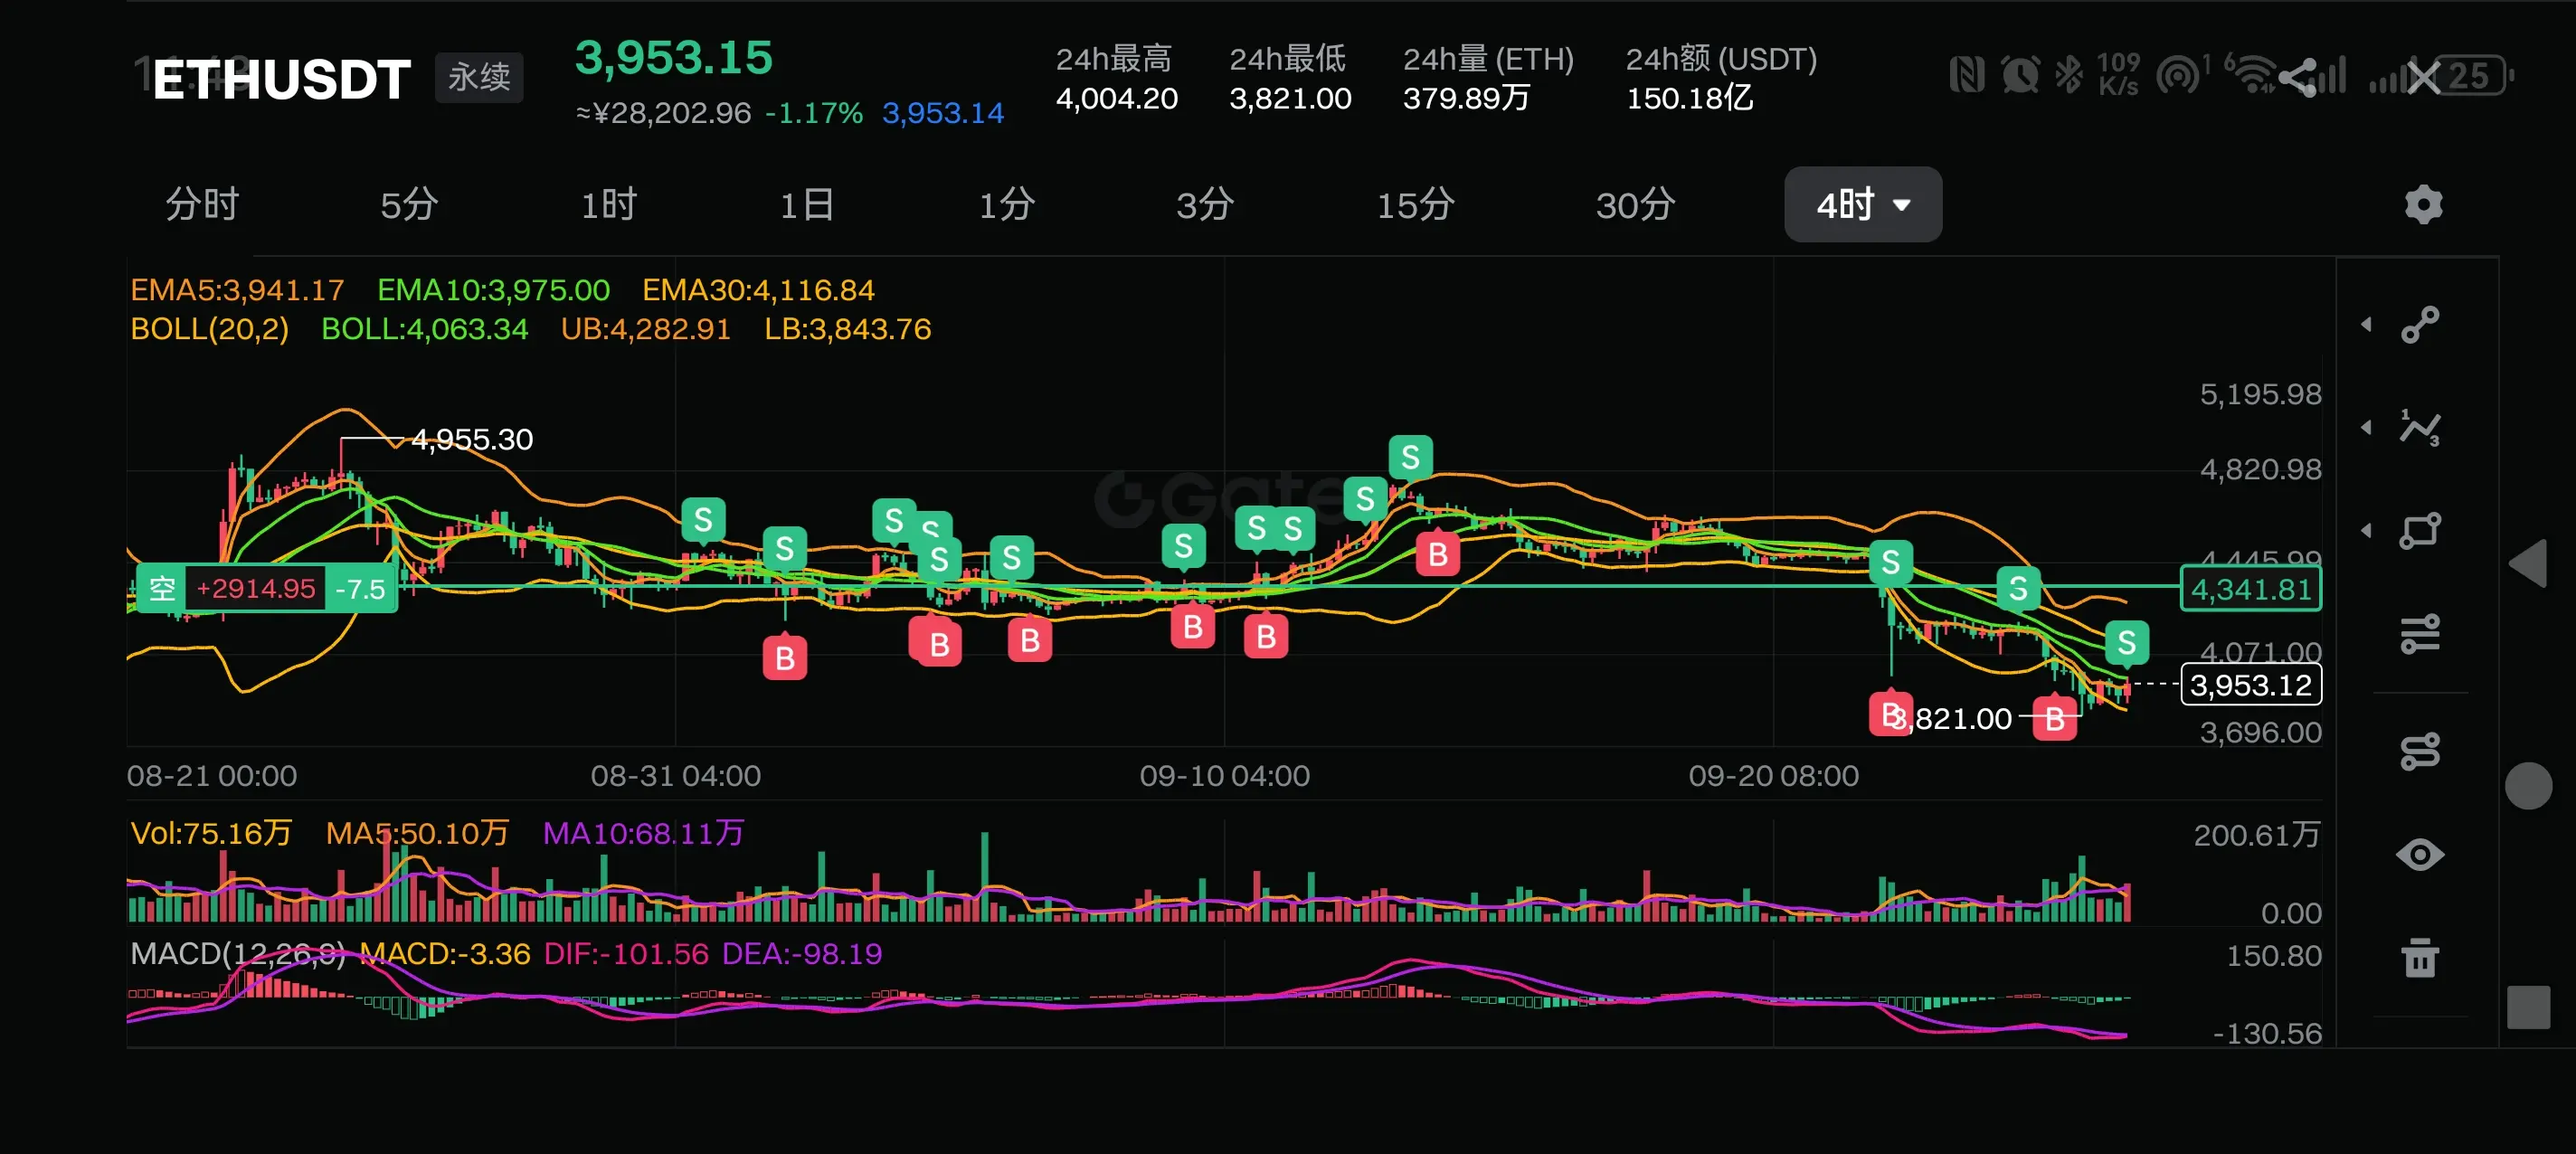
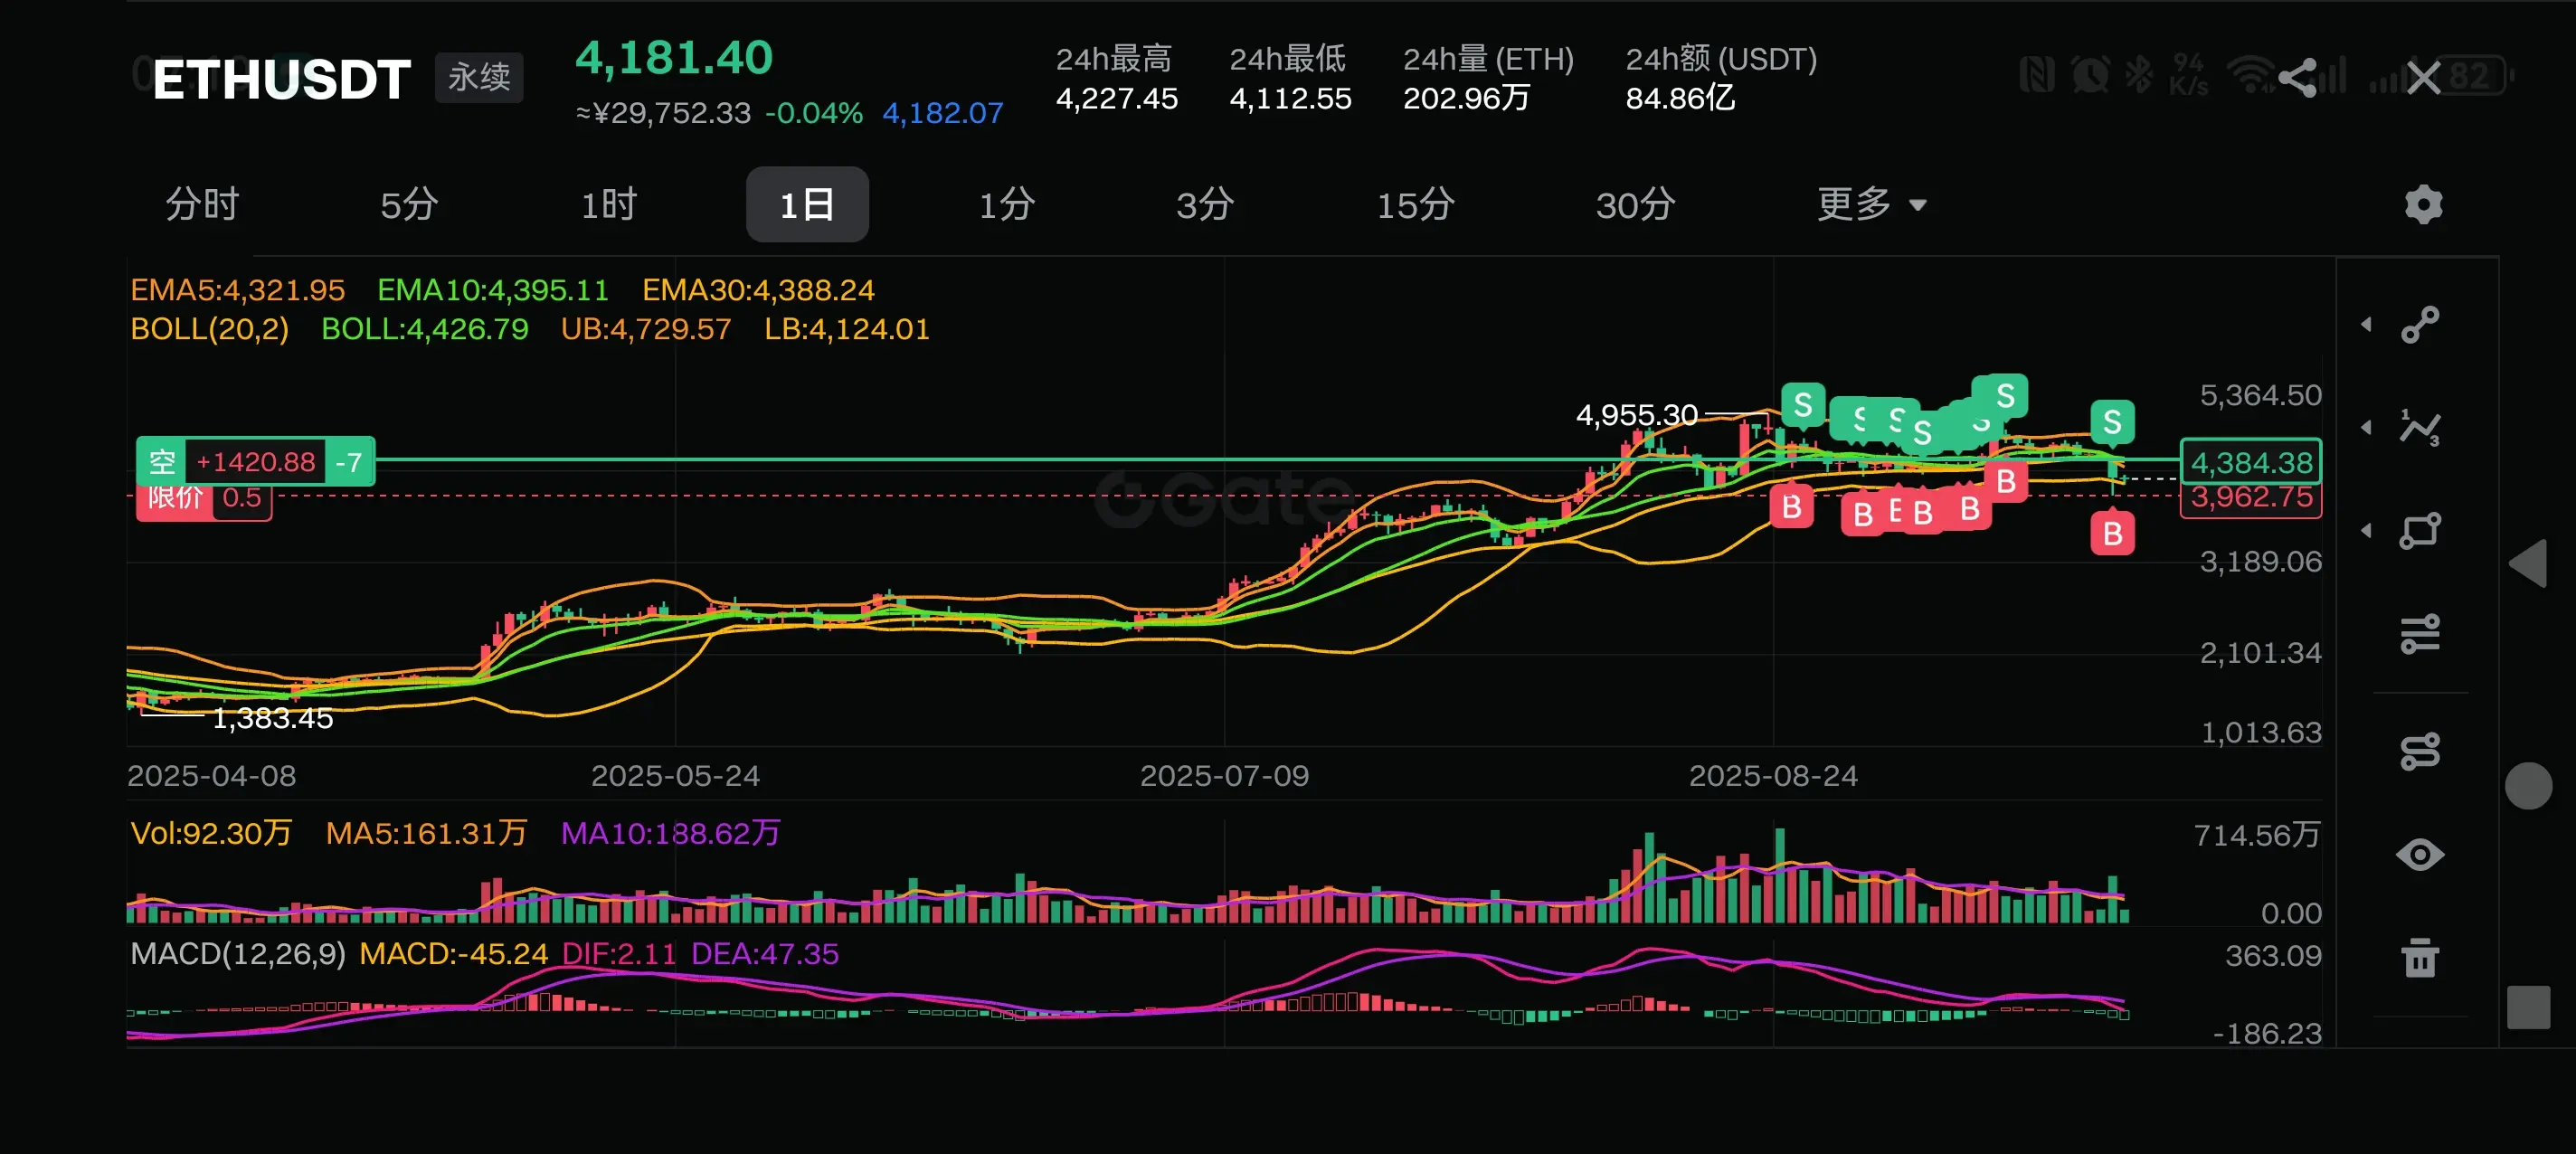
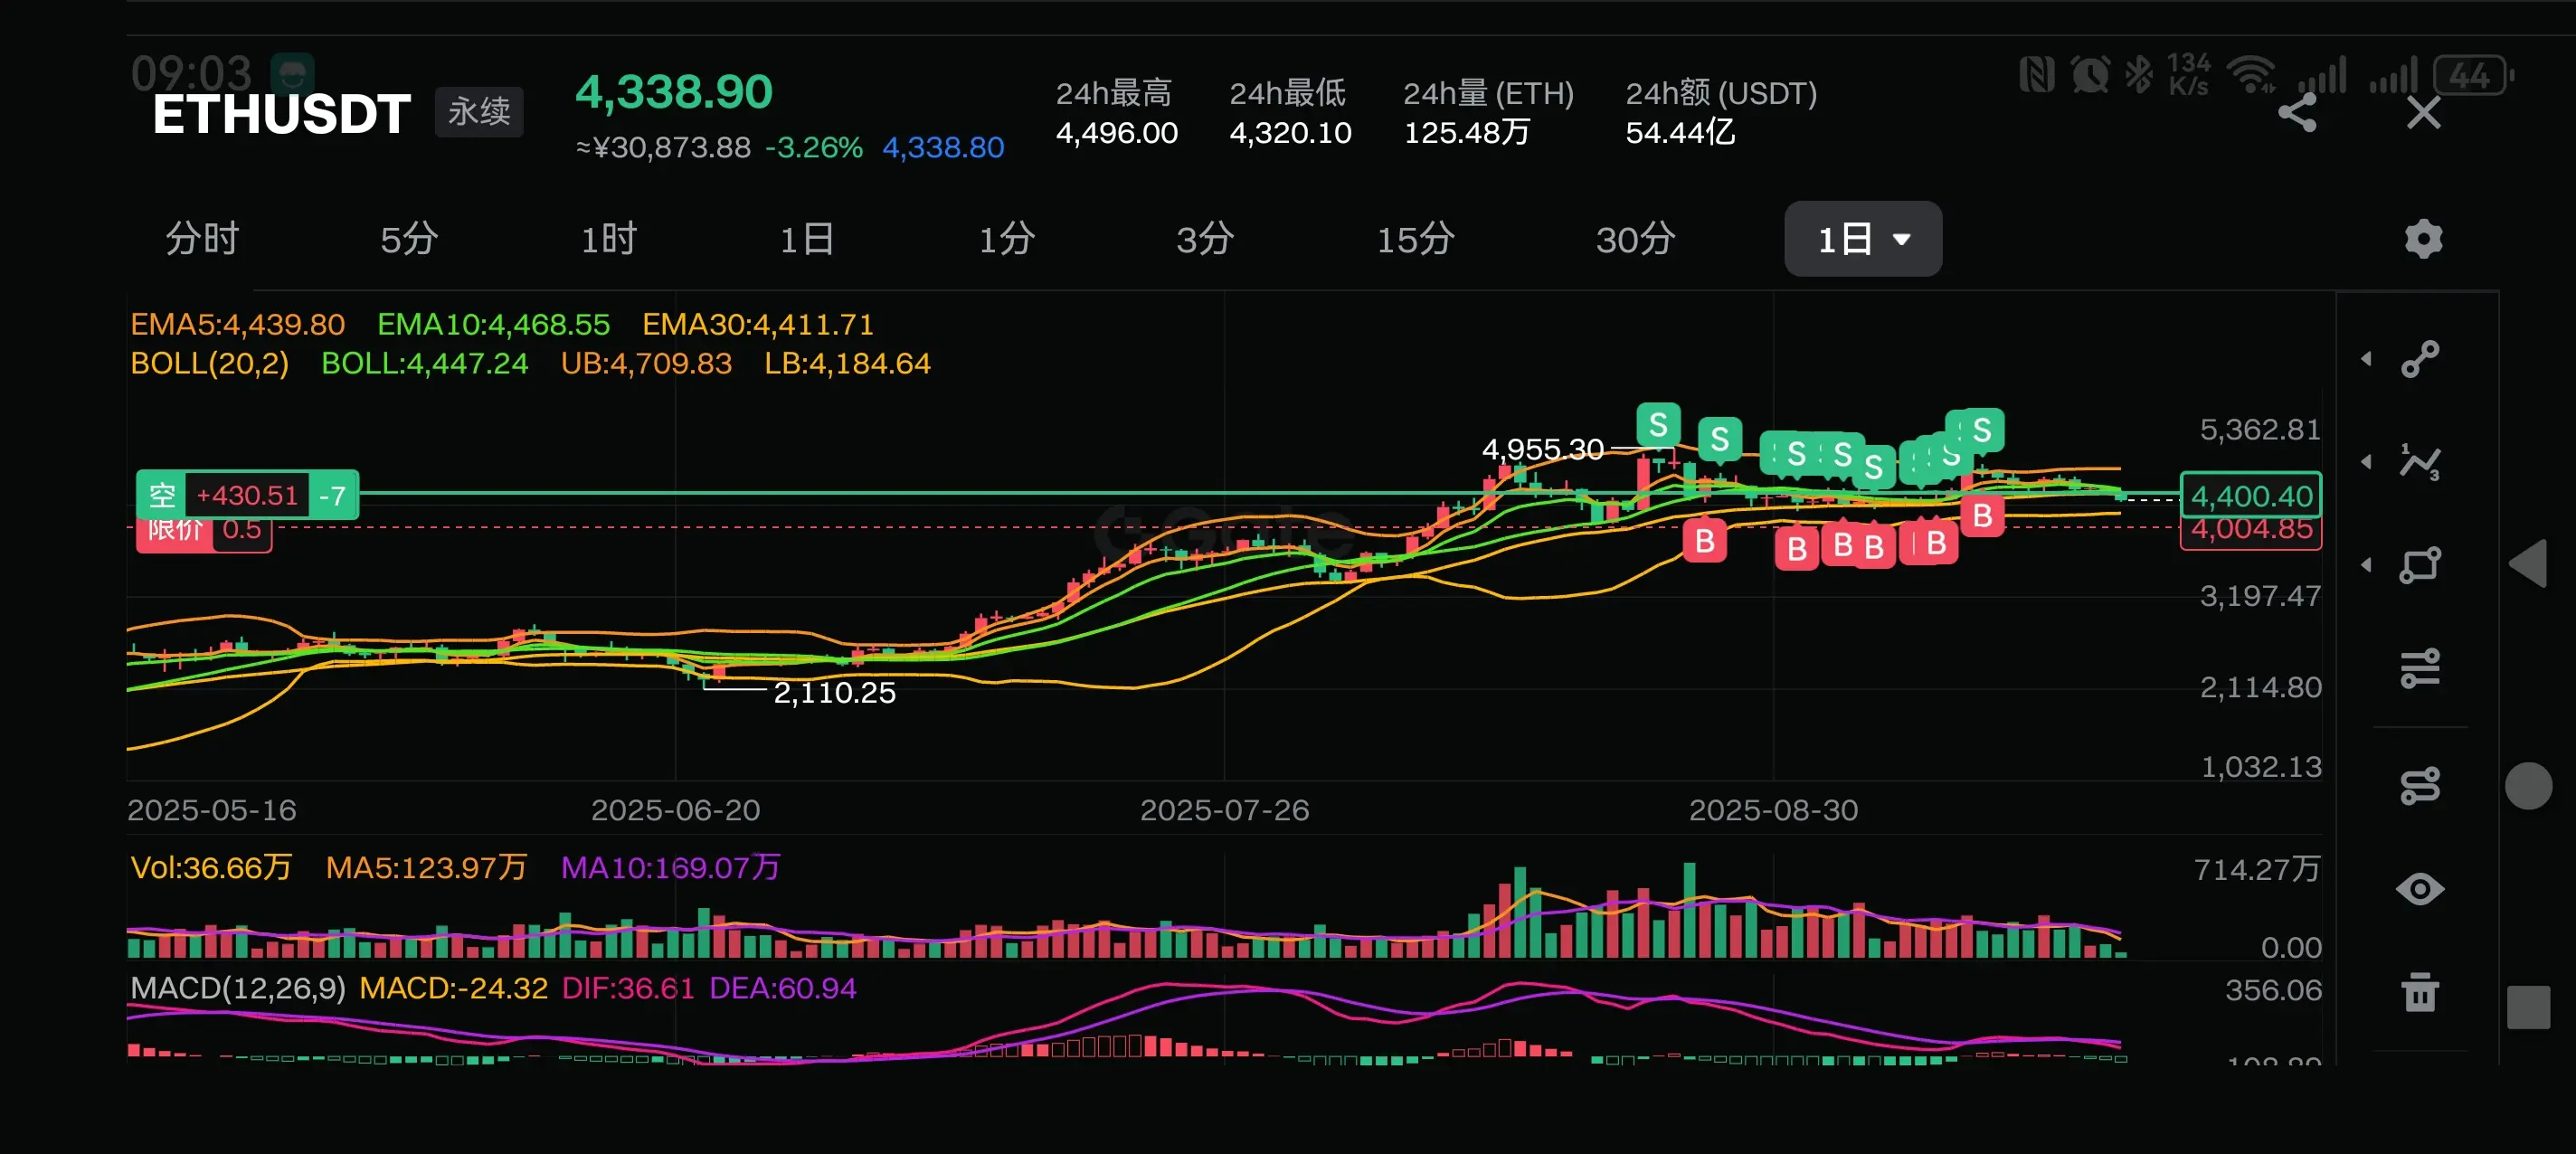
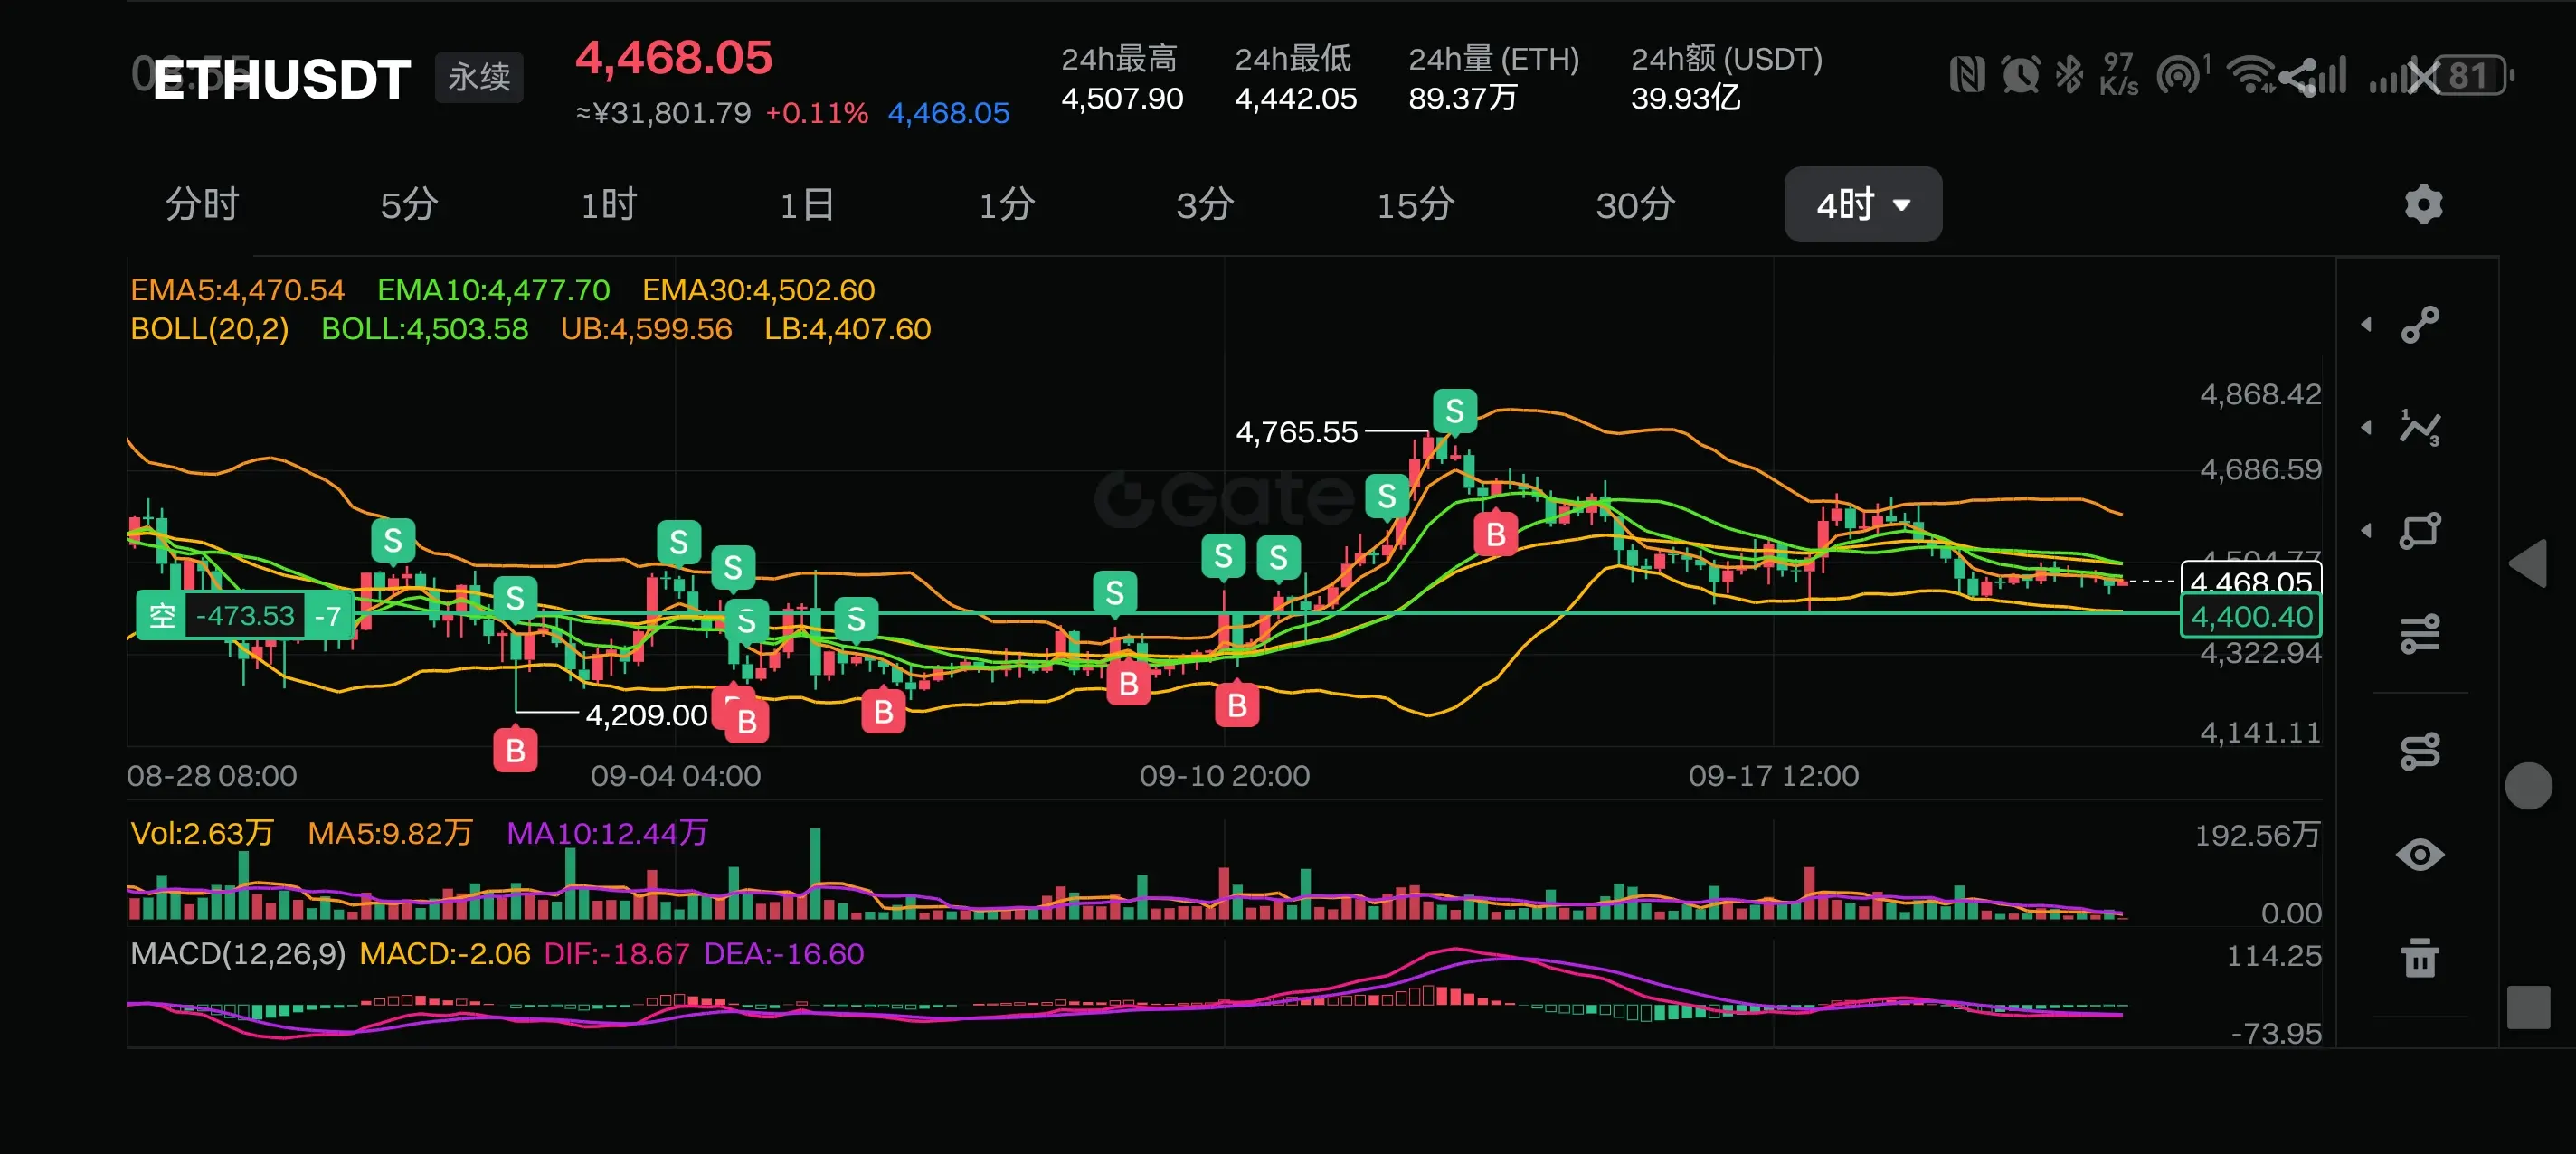
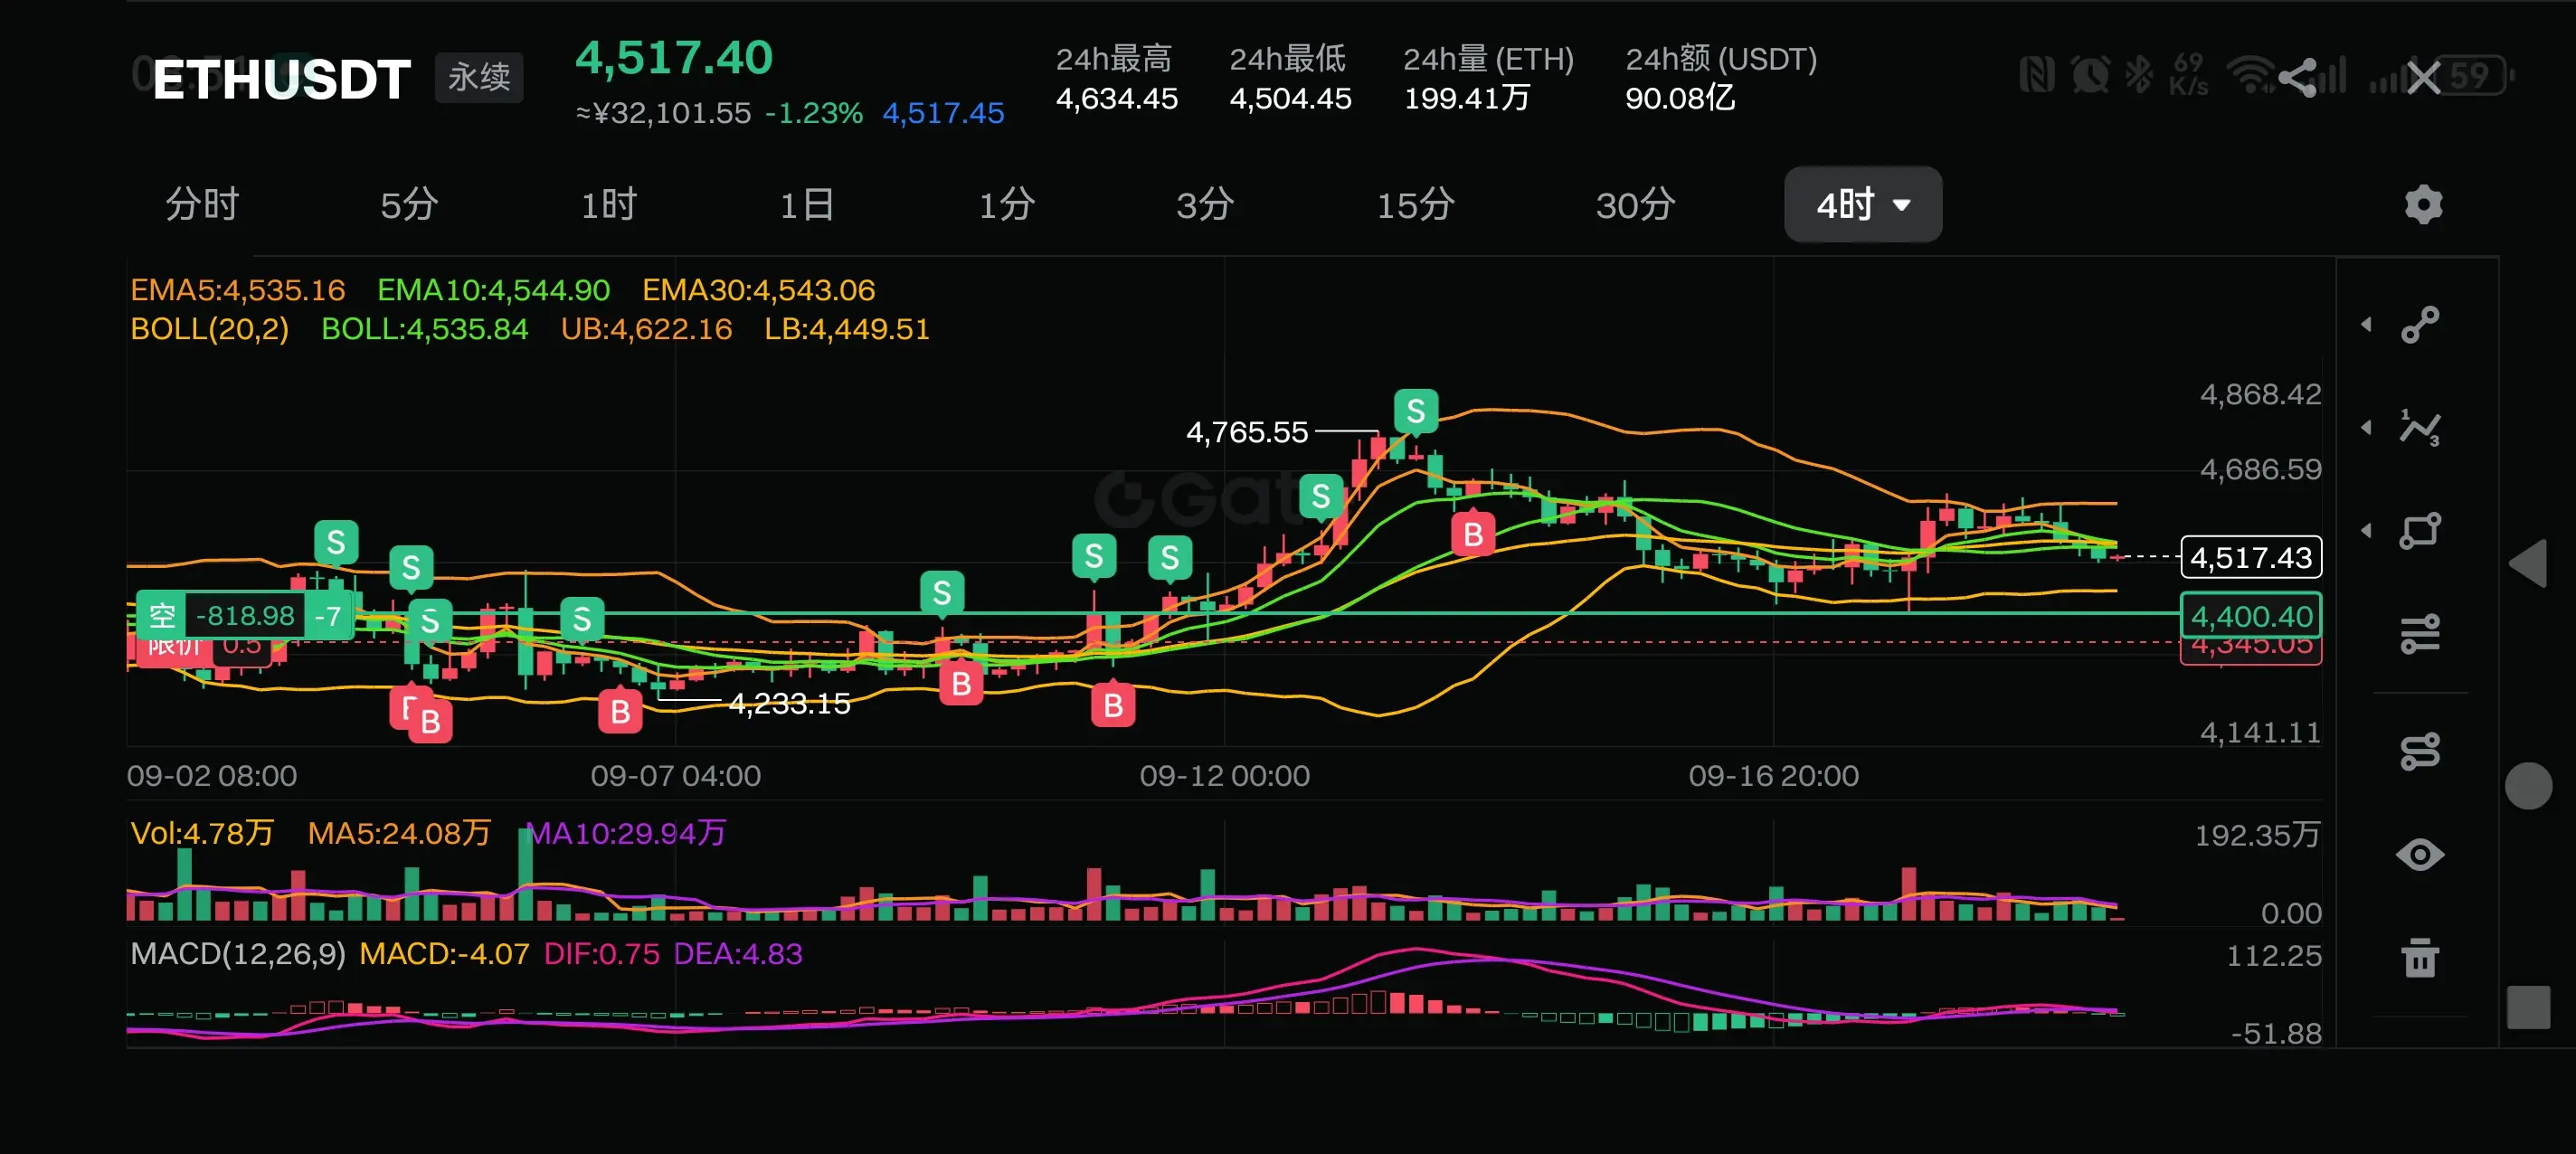
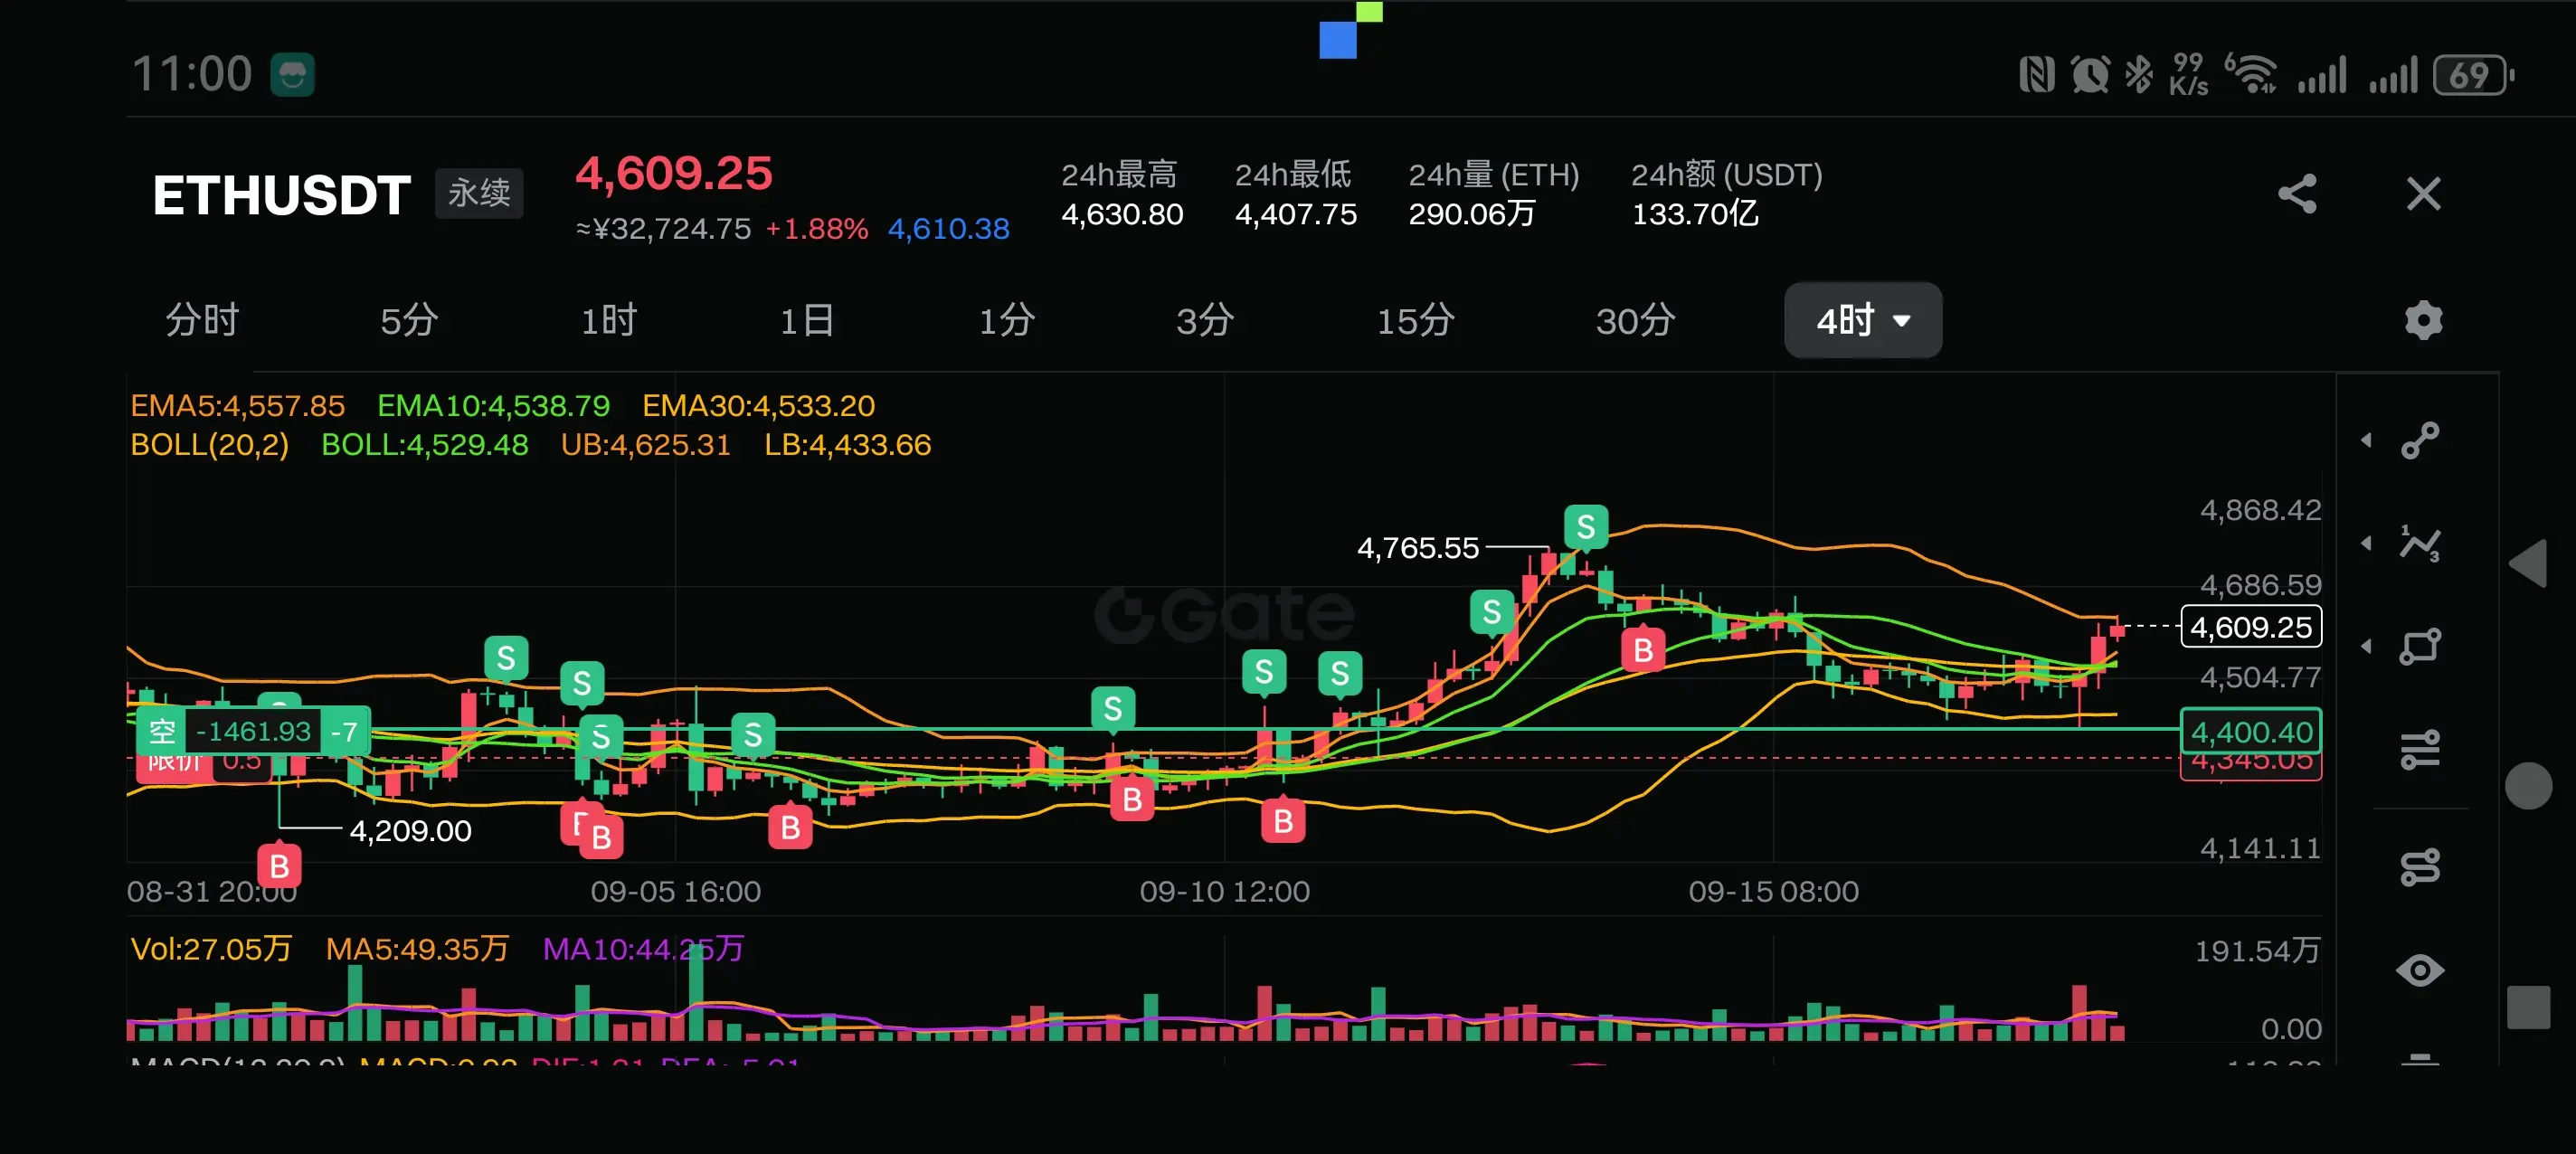
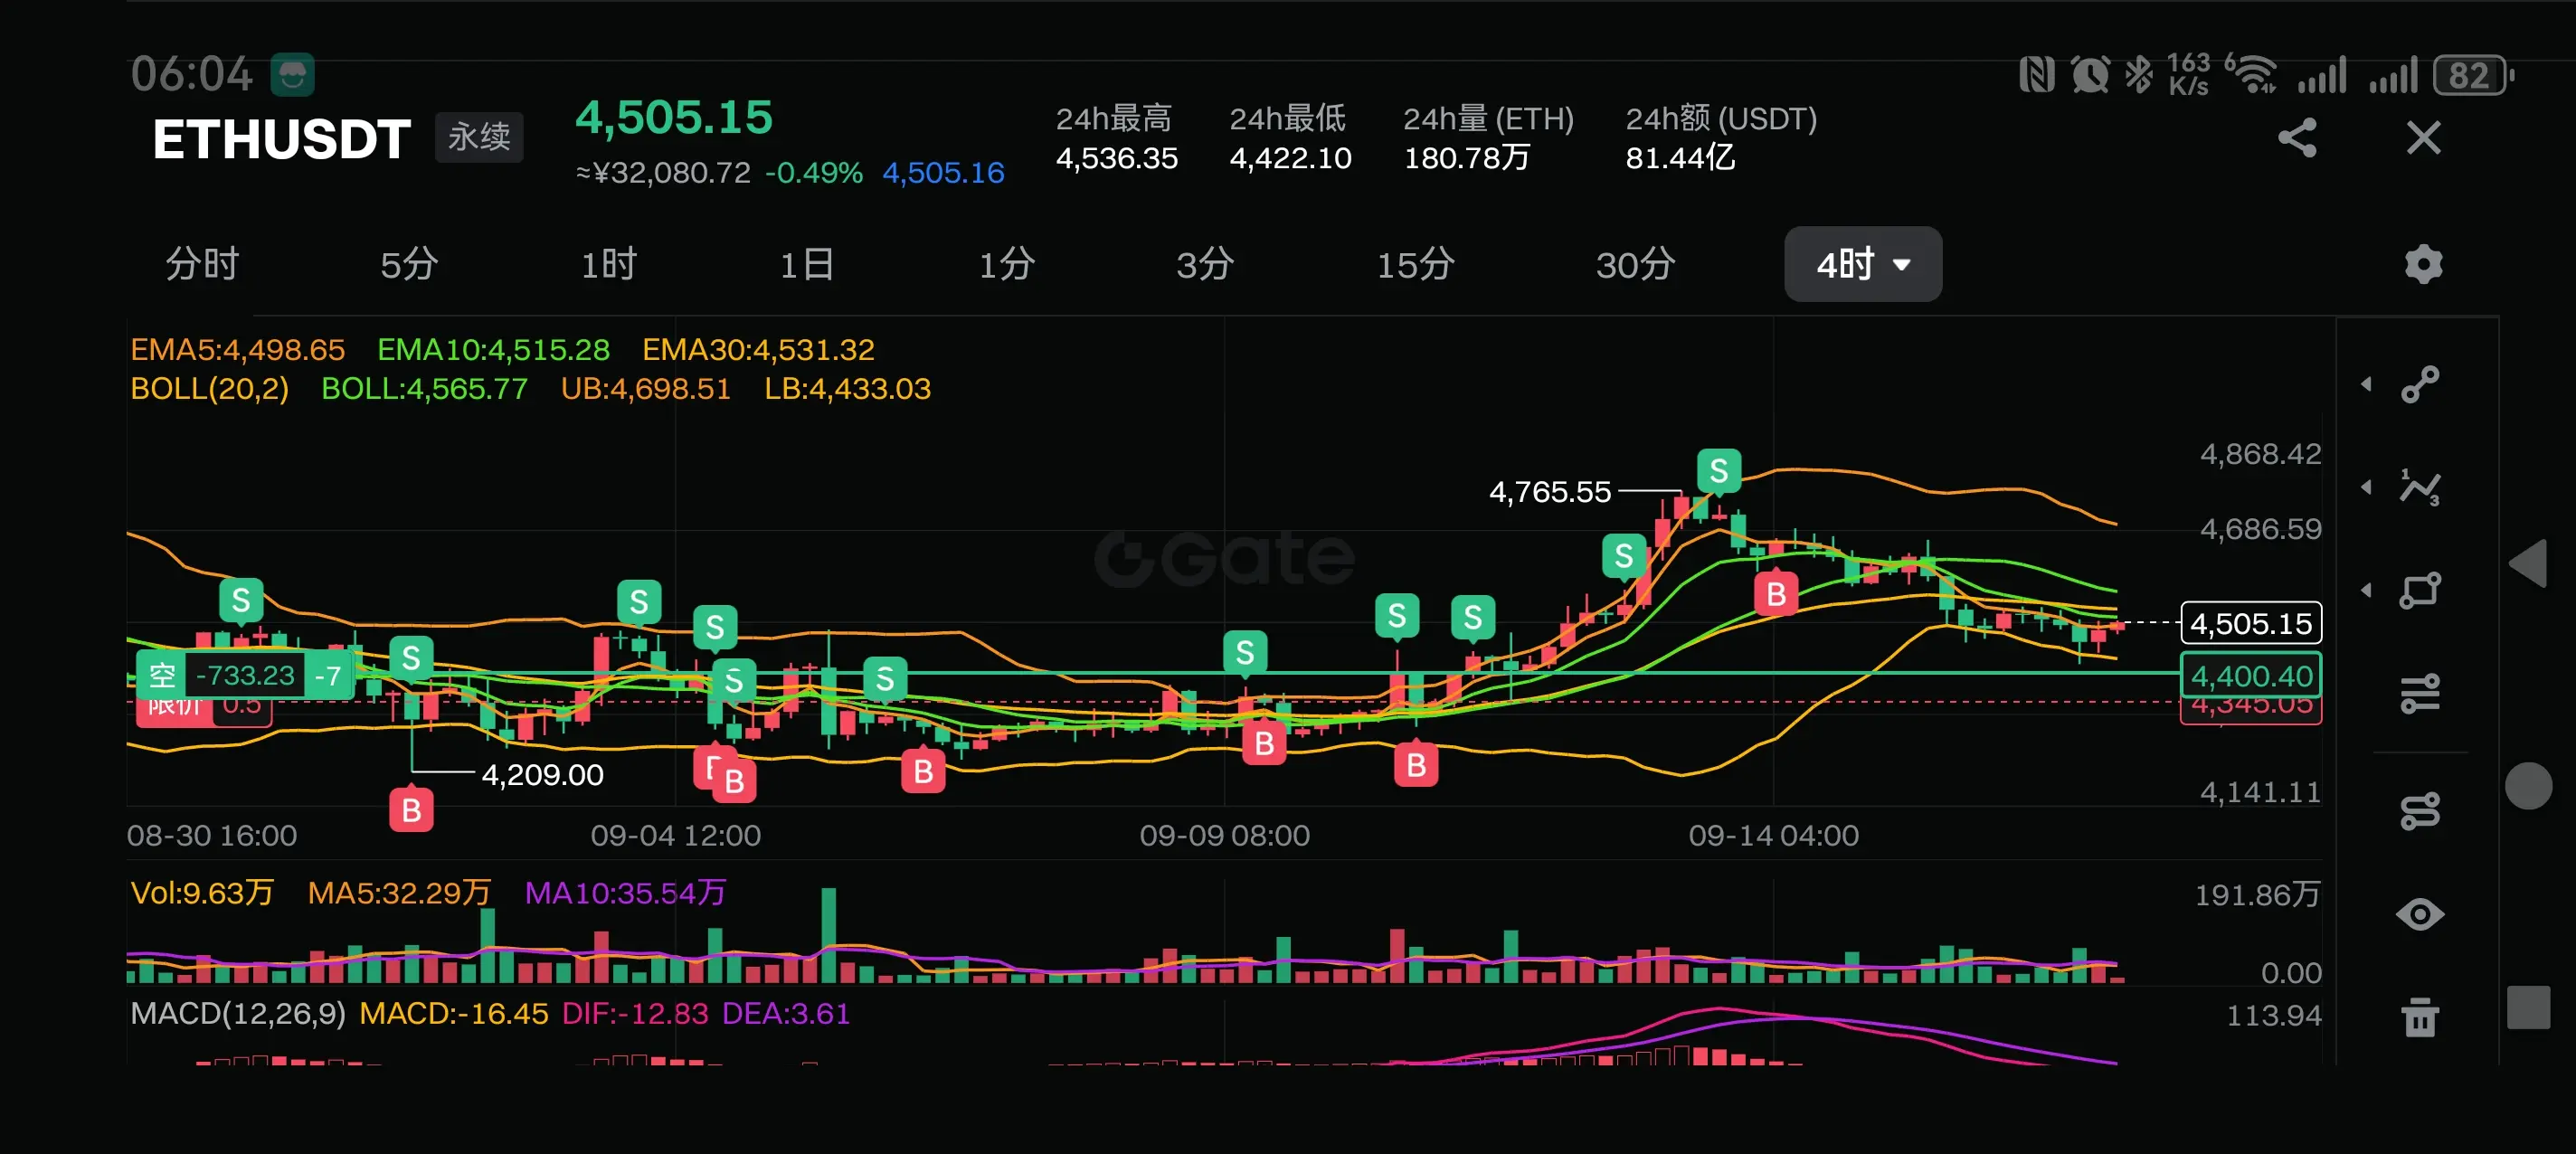
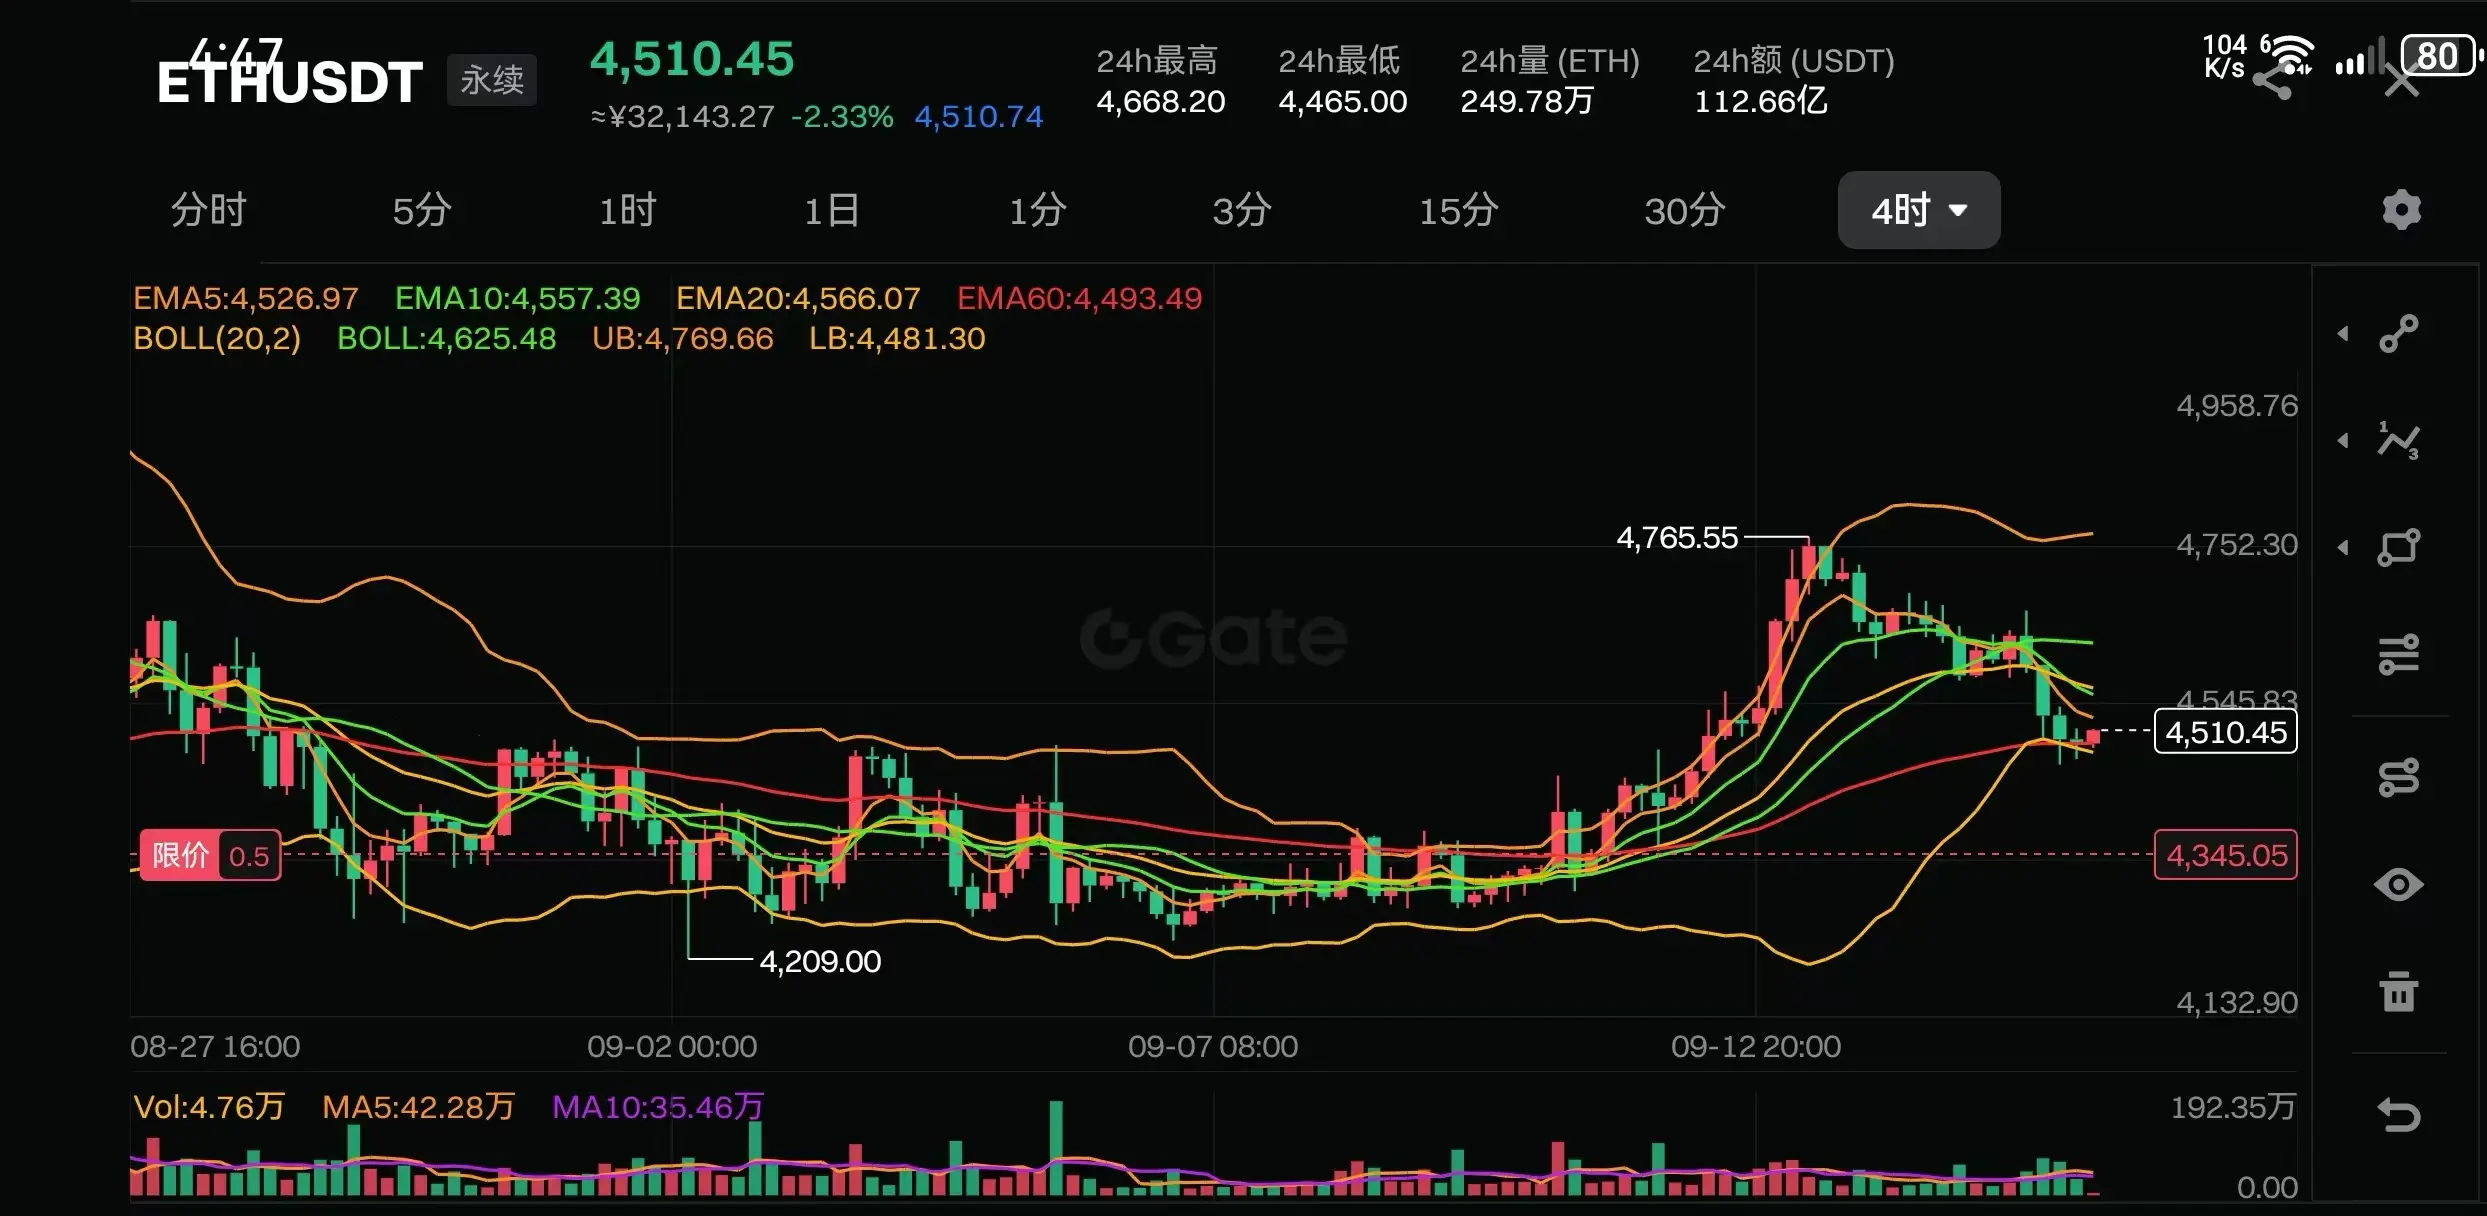
The price has reached a new high but the trading volume has shrunk, forming a "top divergence," indicating a depletion of buying pressure.
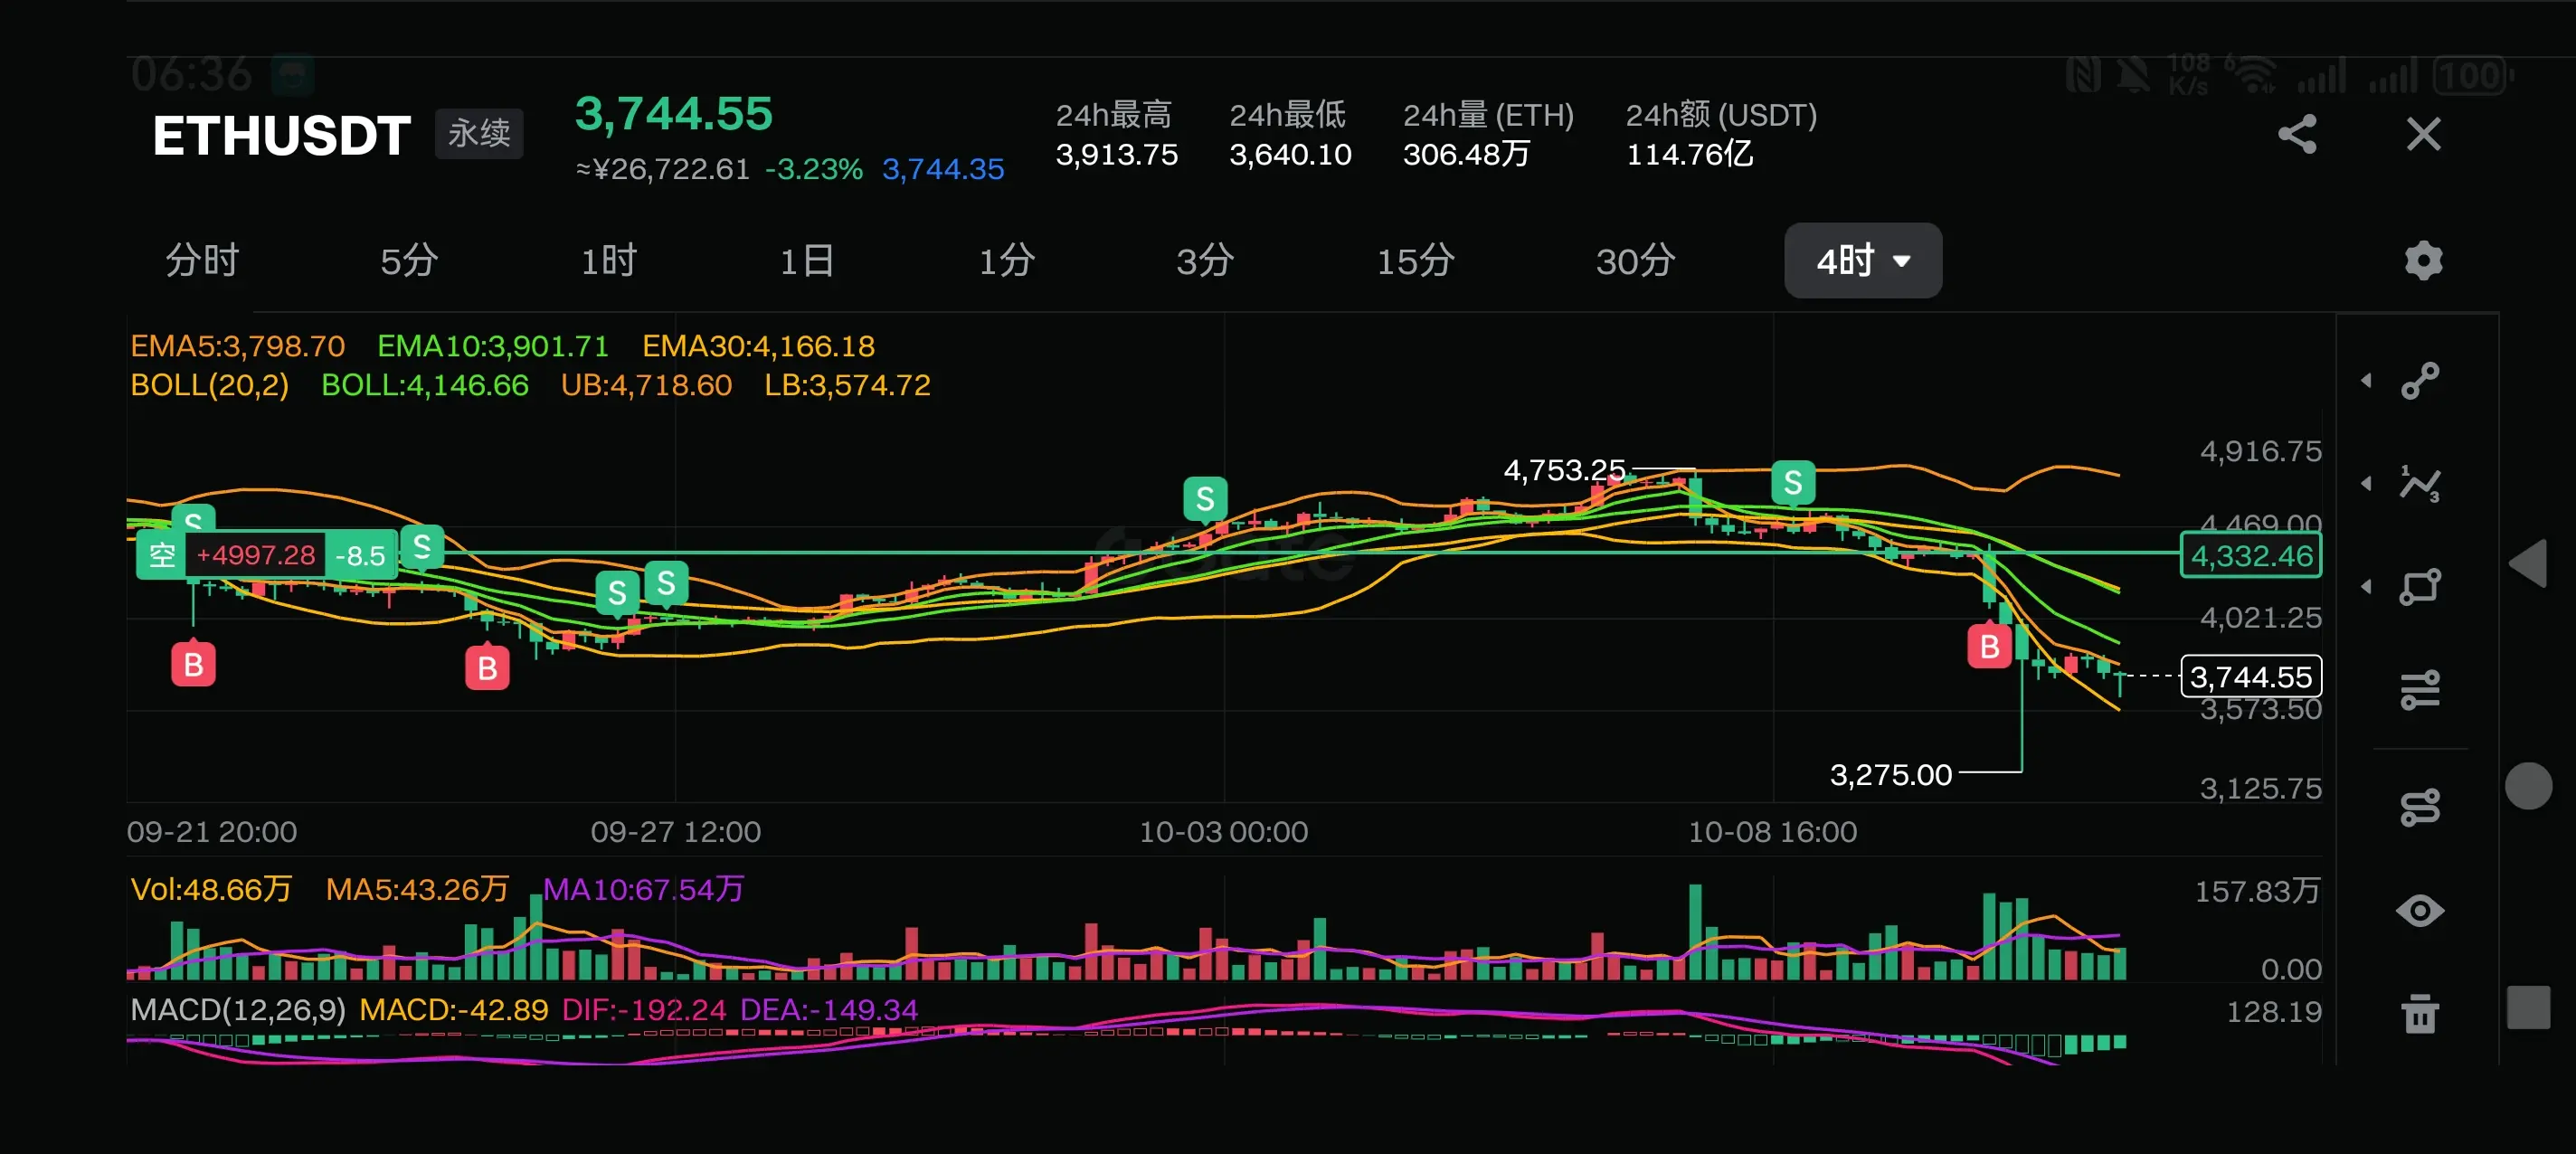
The sudden drop in open interest and the increase in trading volume suggest that bulls are taking profits, and the trend may reverse (for example, when ETH rises to $
View Original📊 1. technical indicator
Trading Volume and Open Interest
Top Signal:
The price has reached a new high but the trading volume has shrunk, forming a "top divergence," indicating a depletion of buying pressure.
The sudden drop in open interest and the increase in trading volume suggest that bulls are taking profits, and the trend may reverse (for example, when ETH rises to $
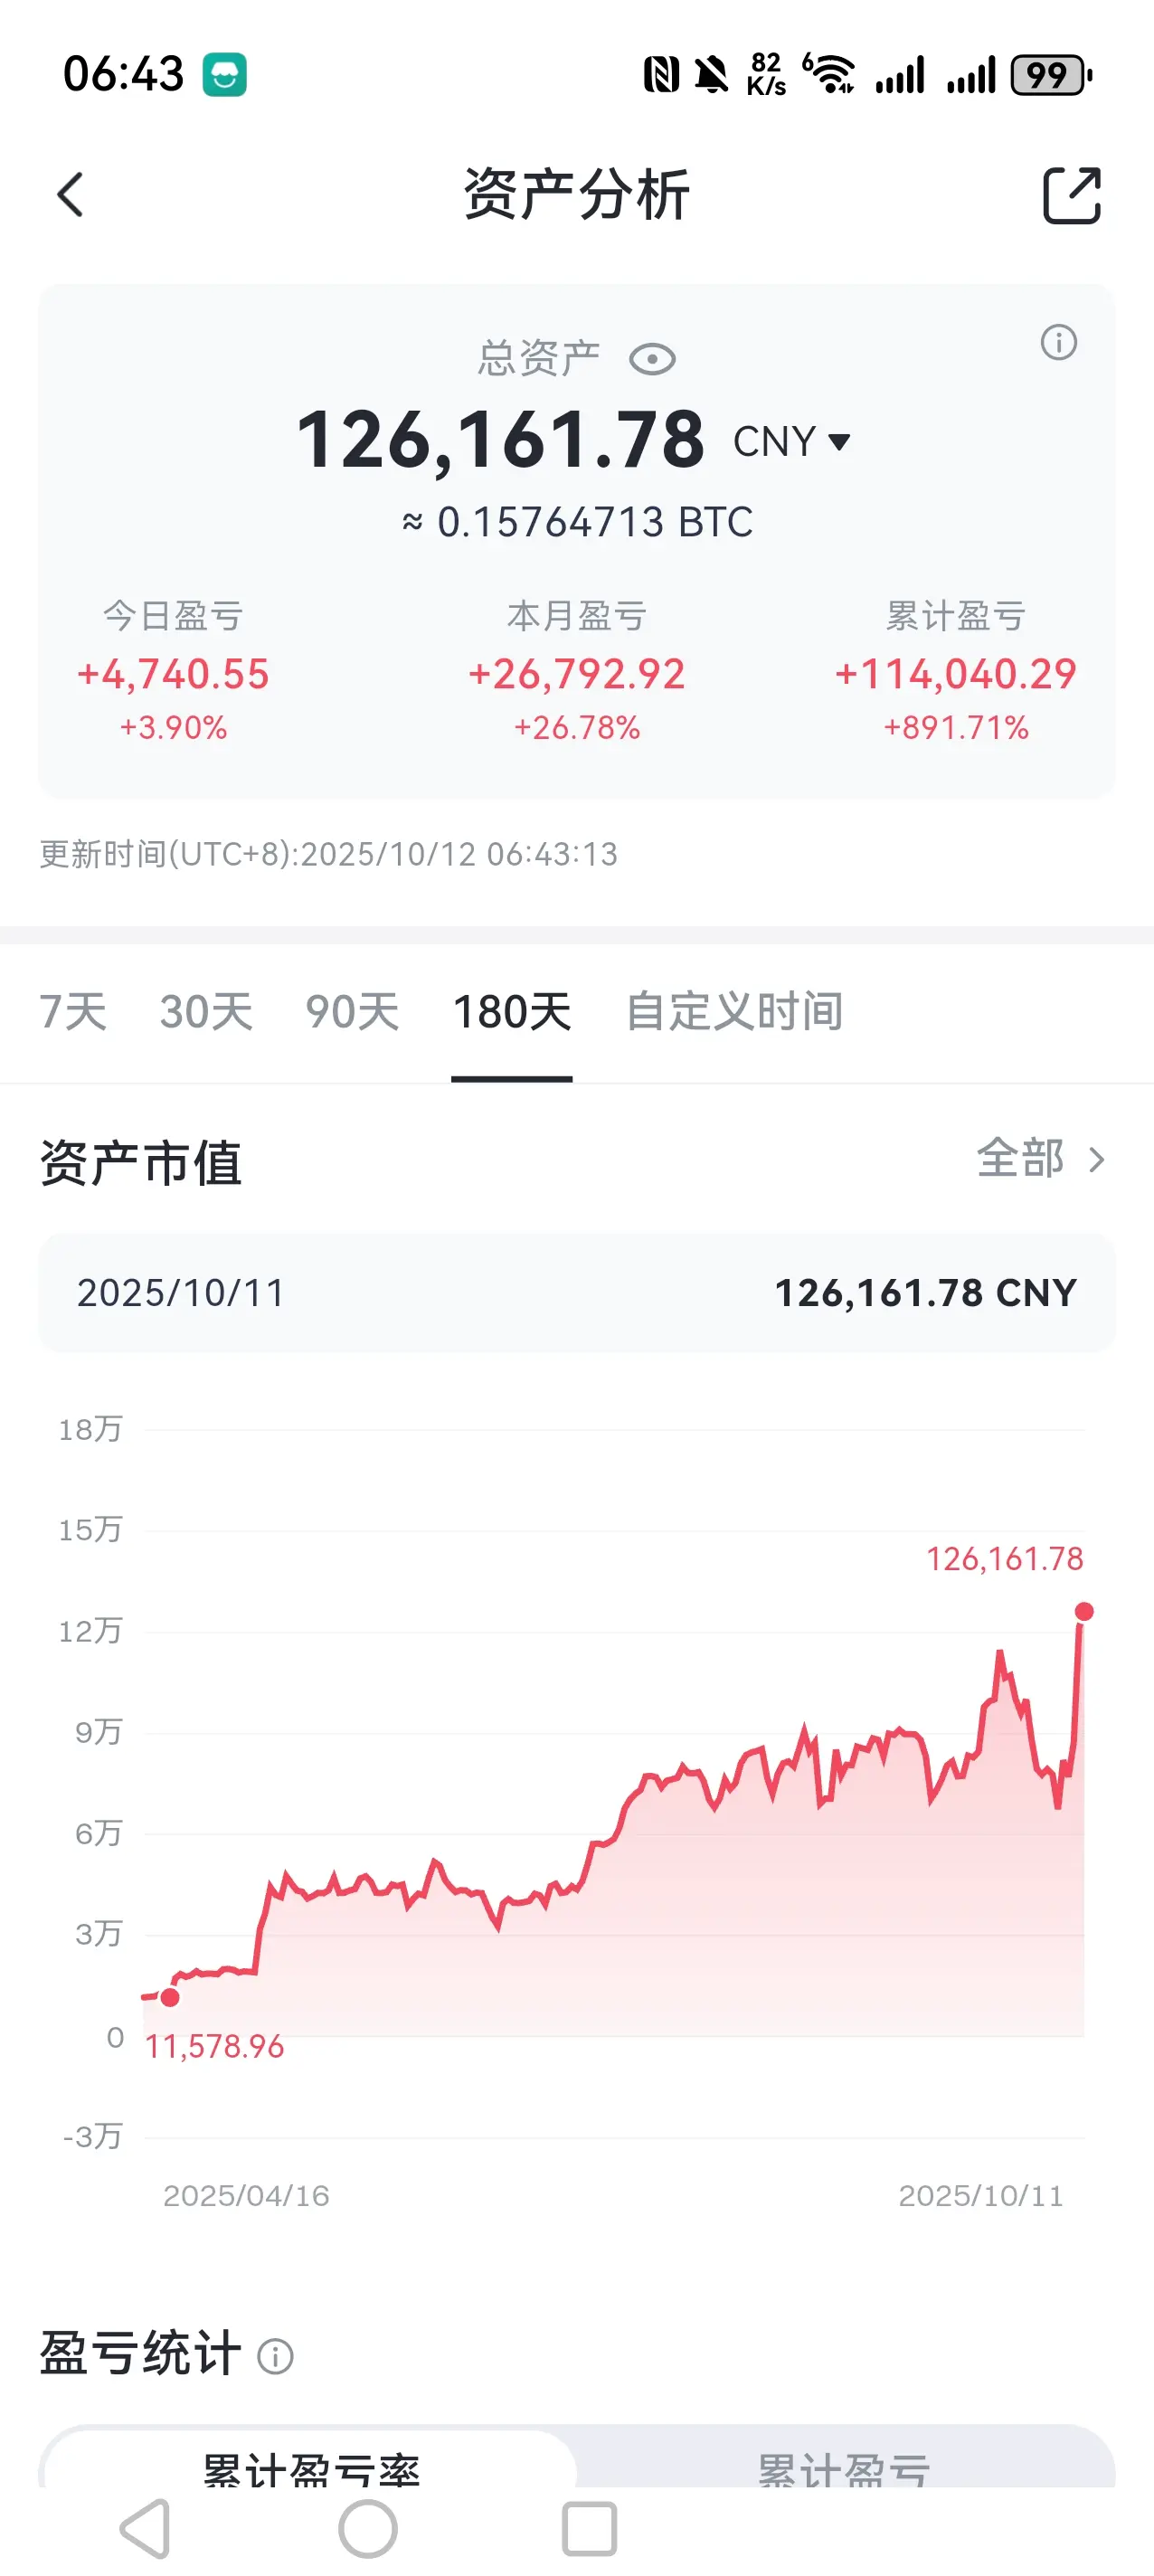
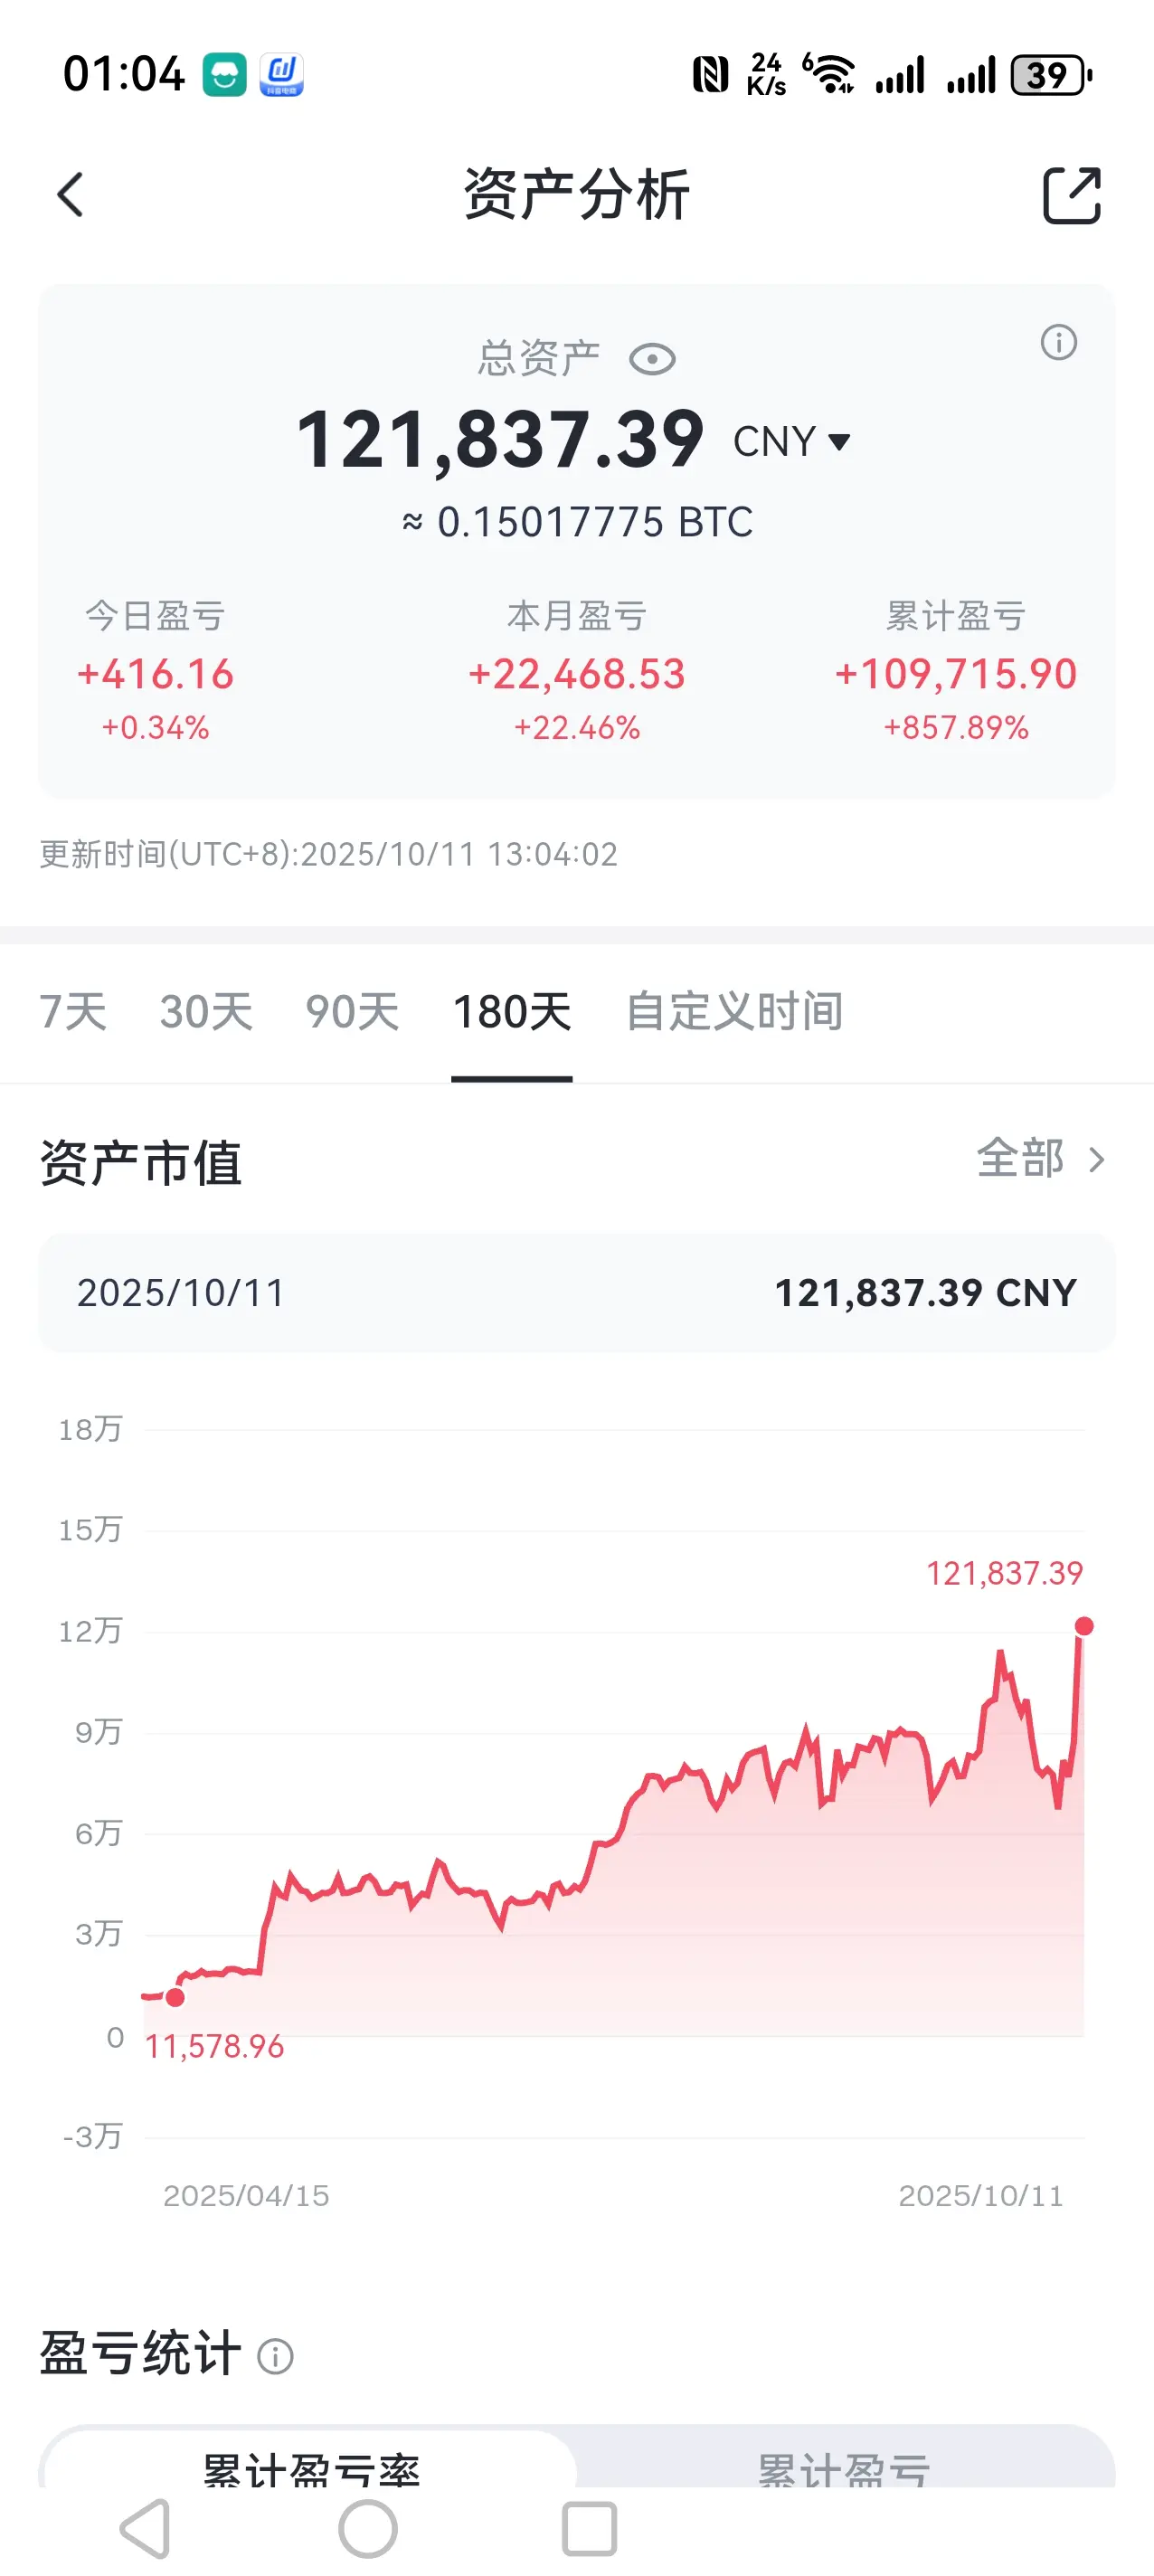
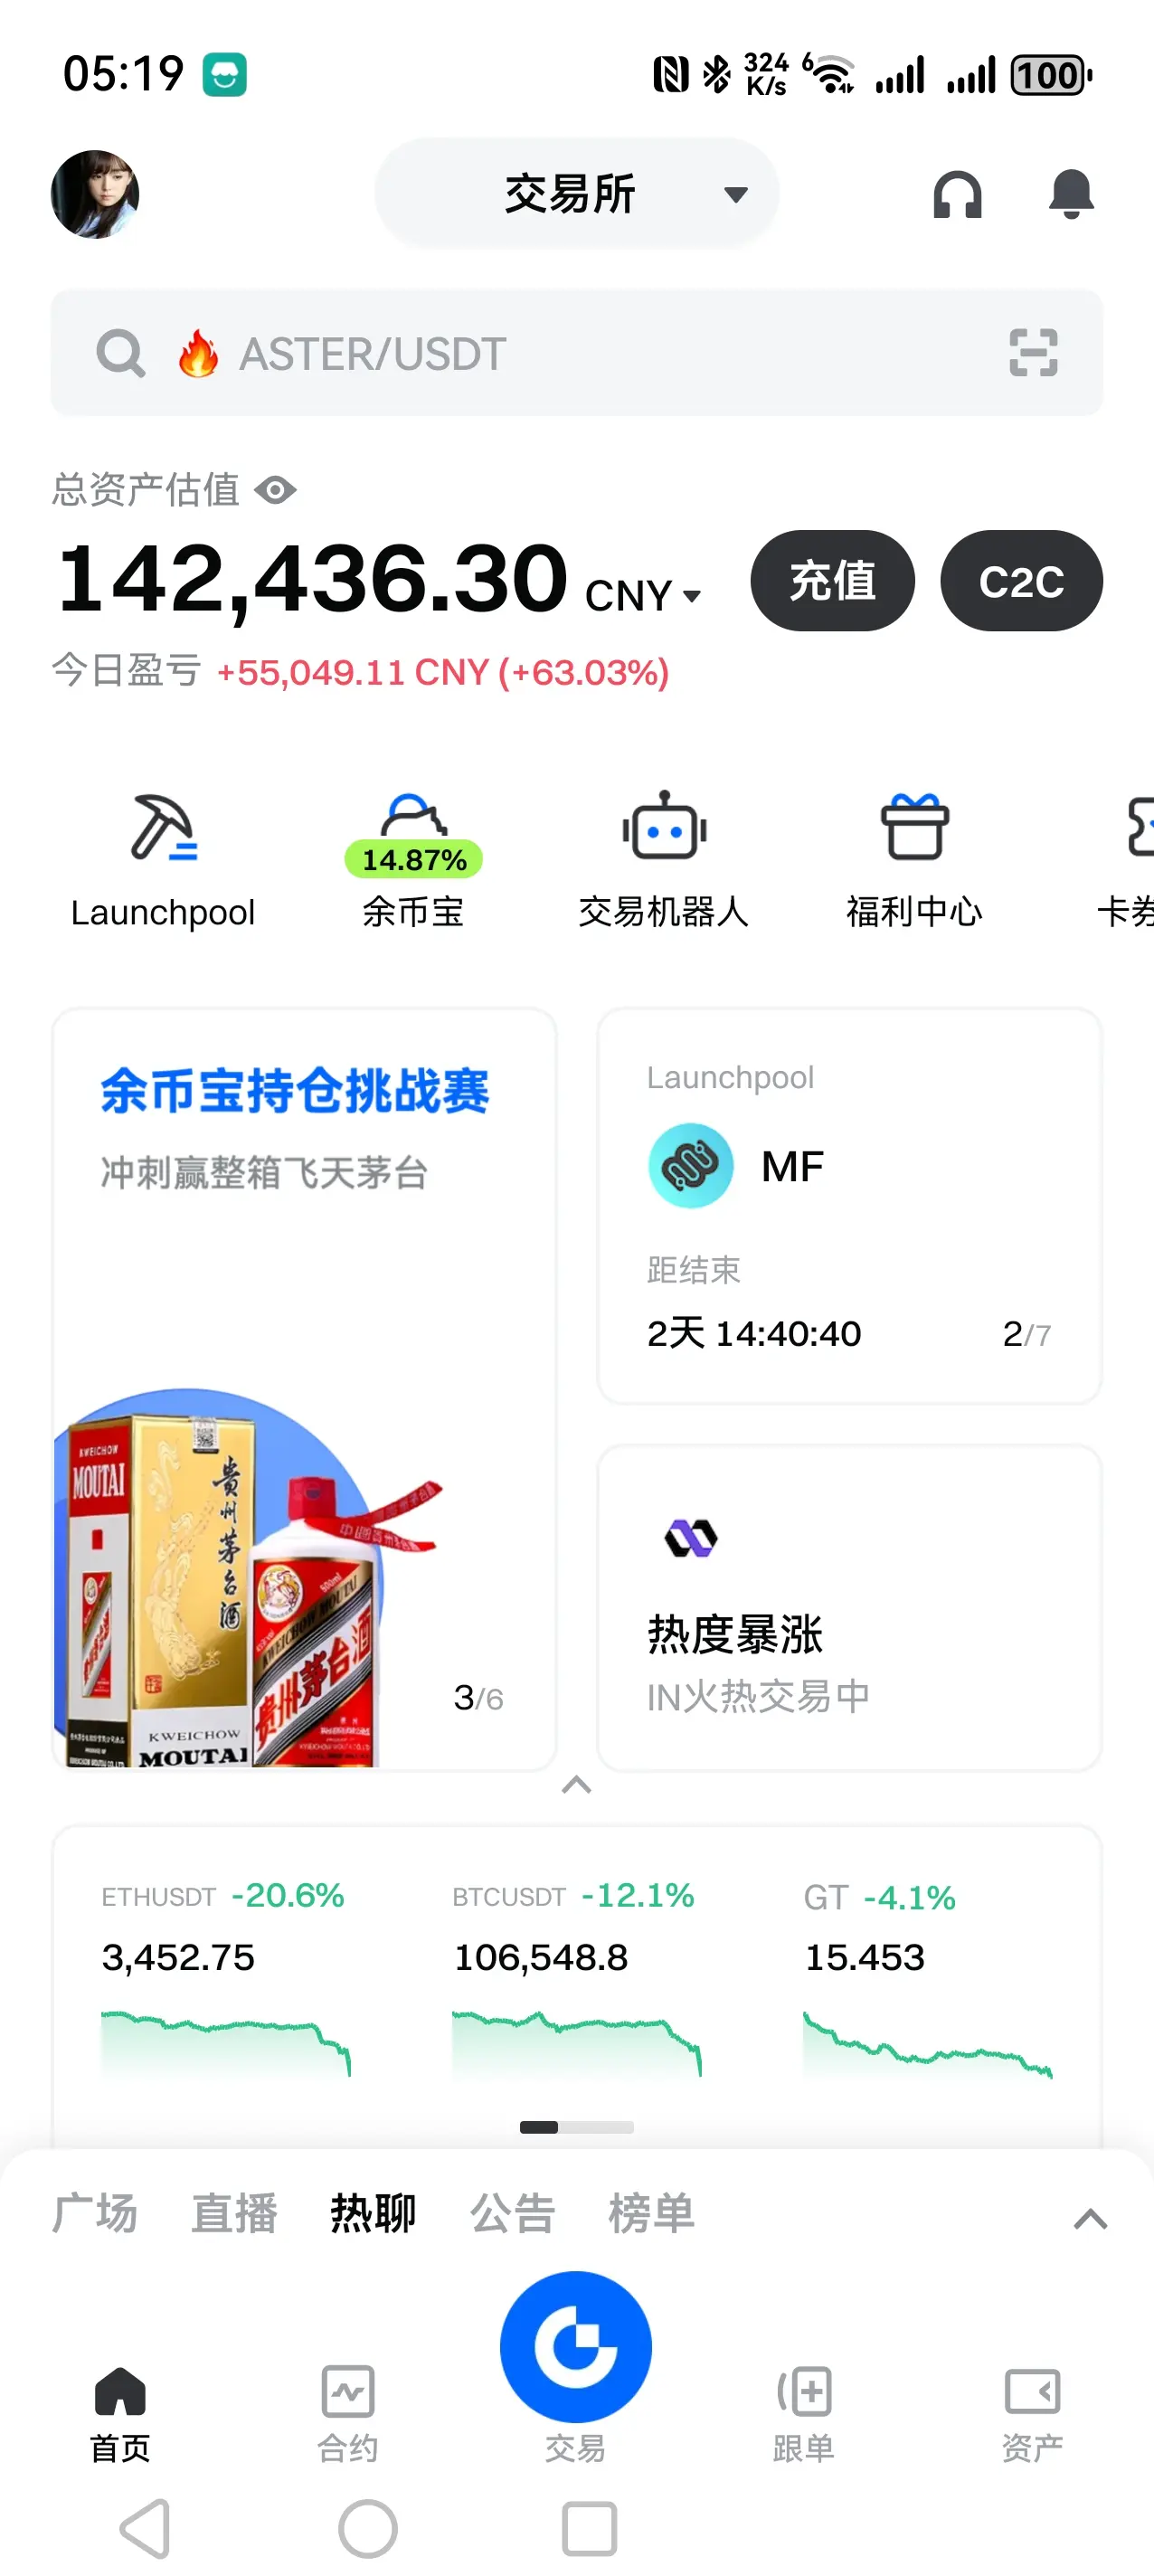
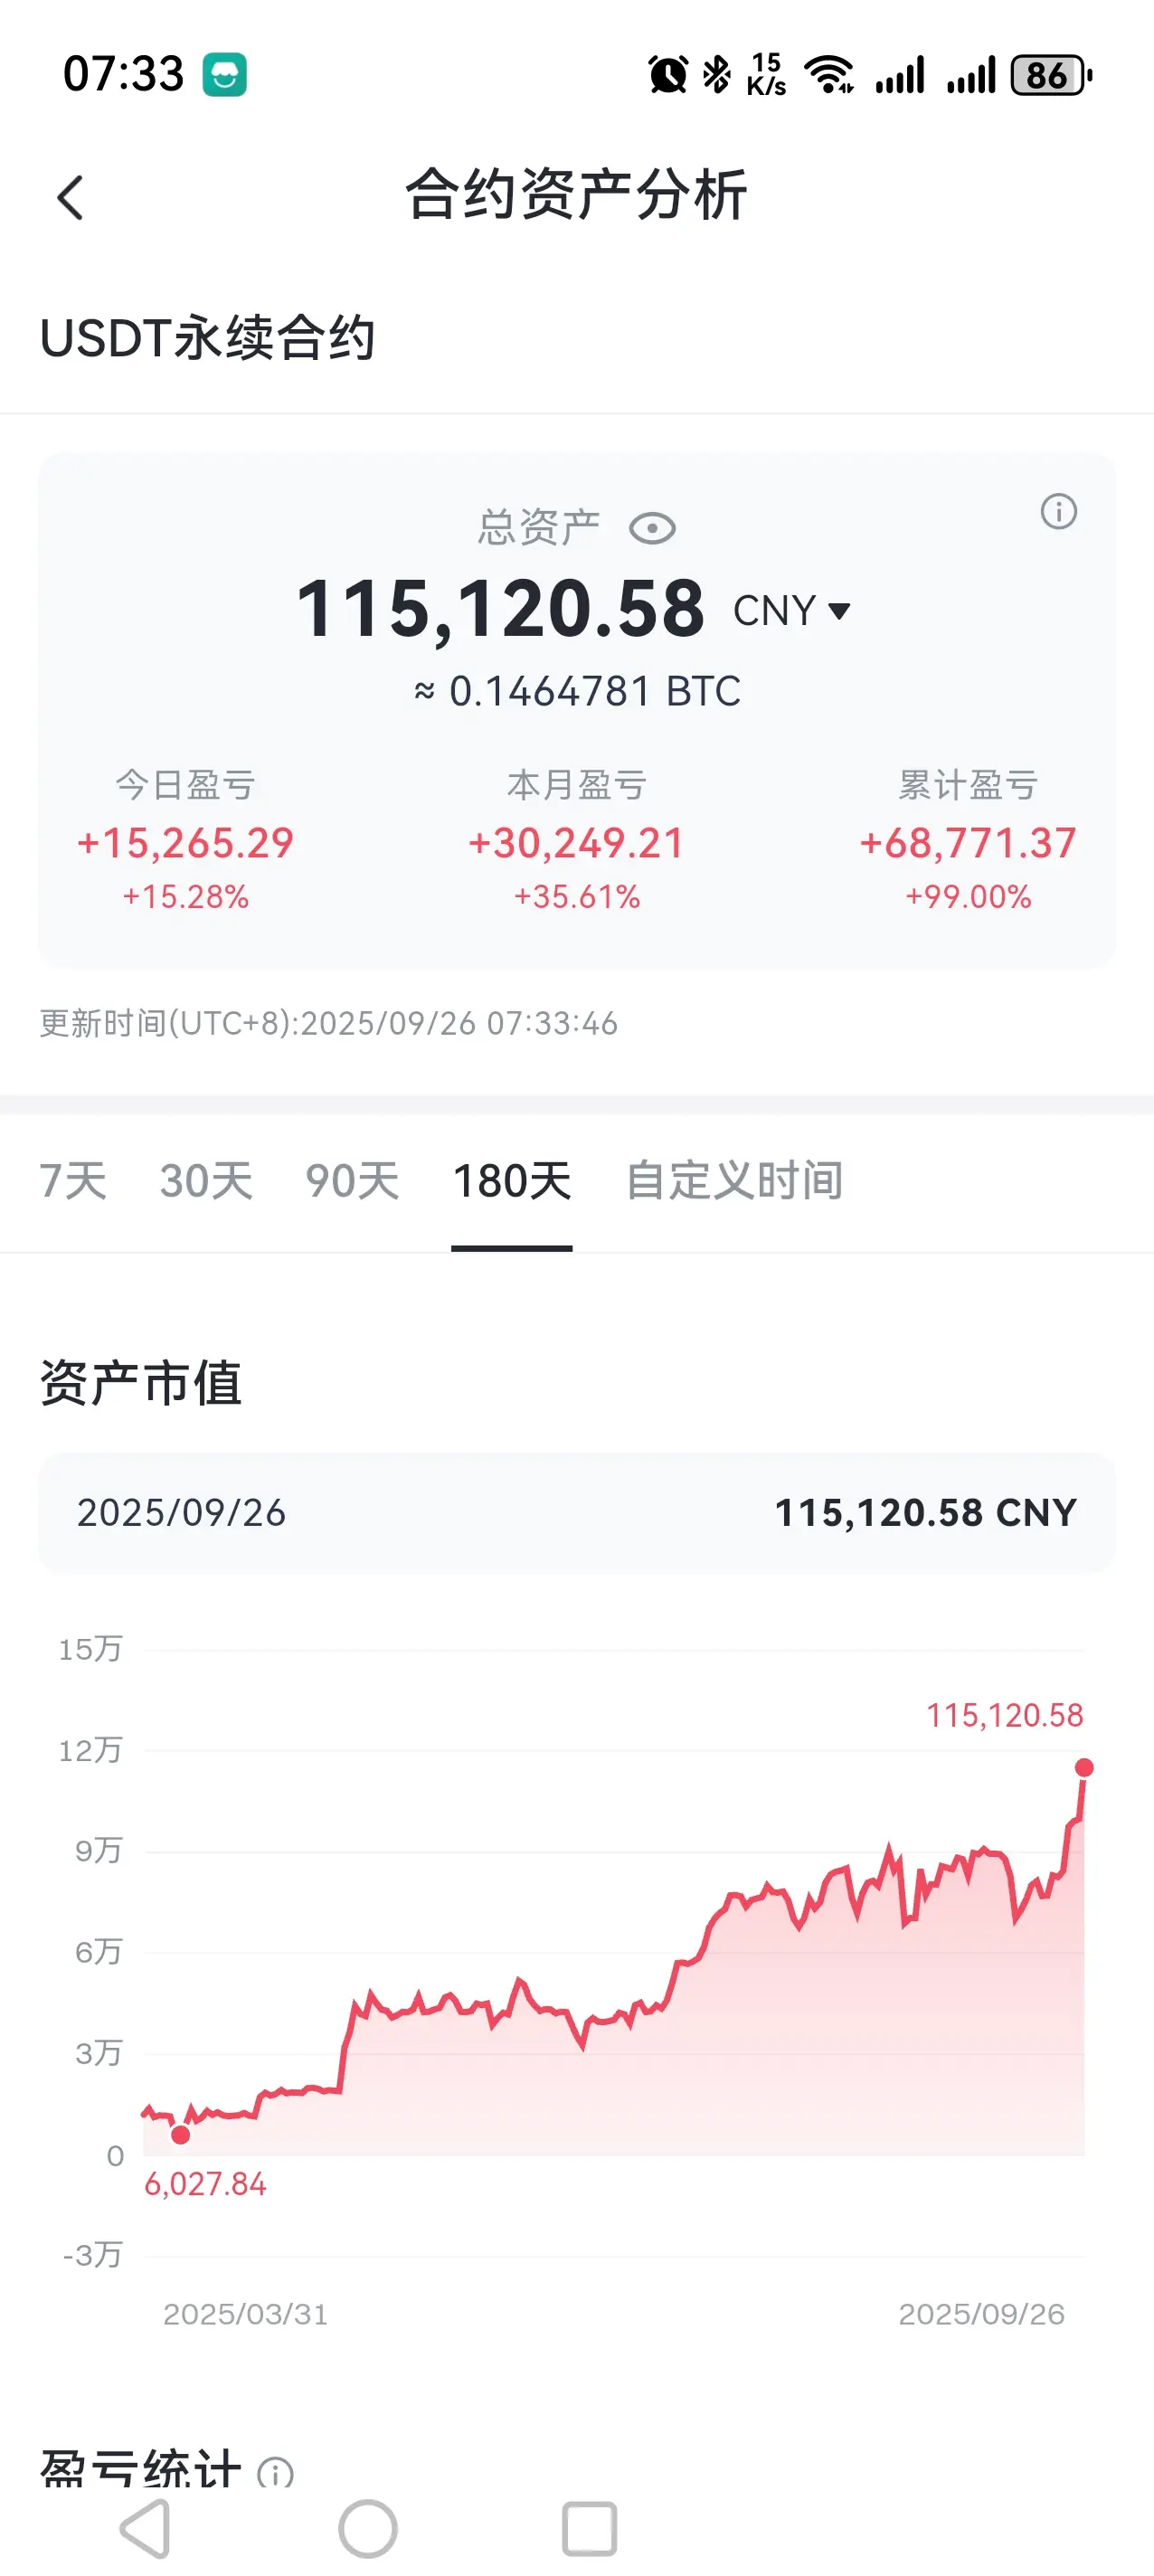
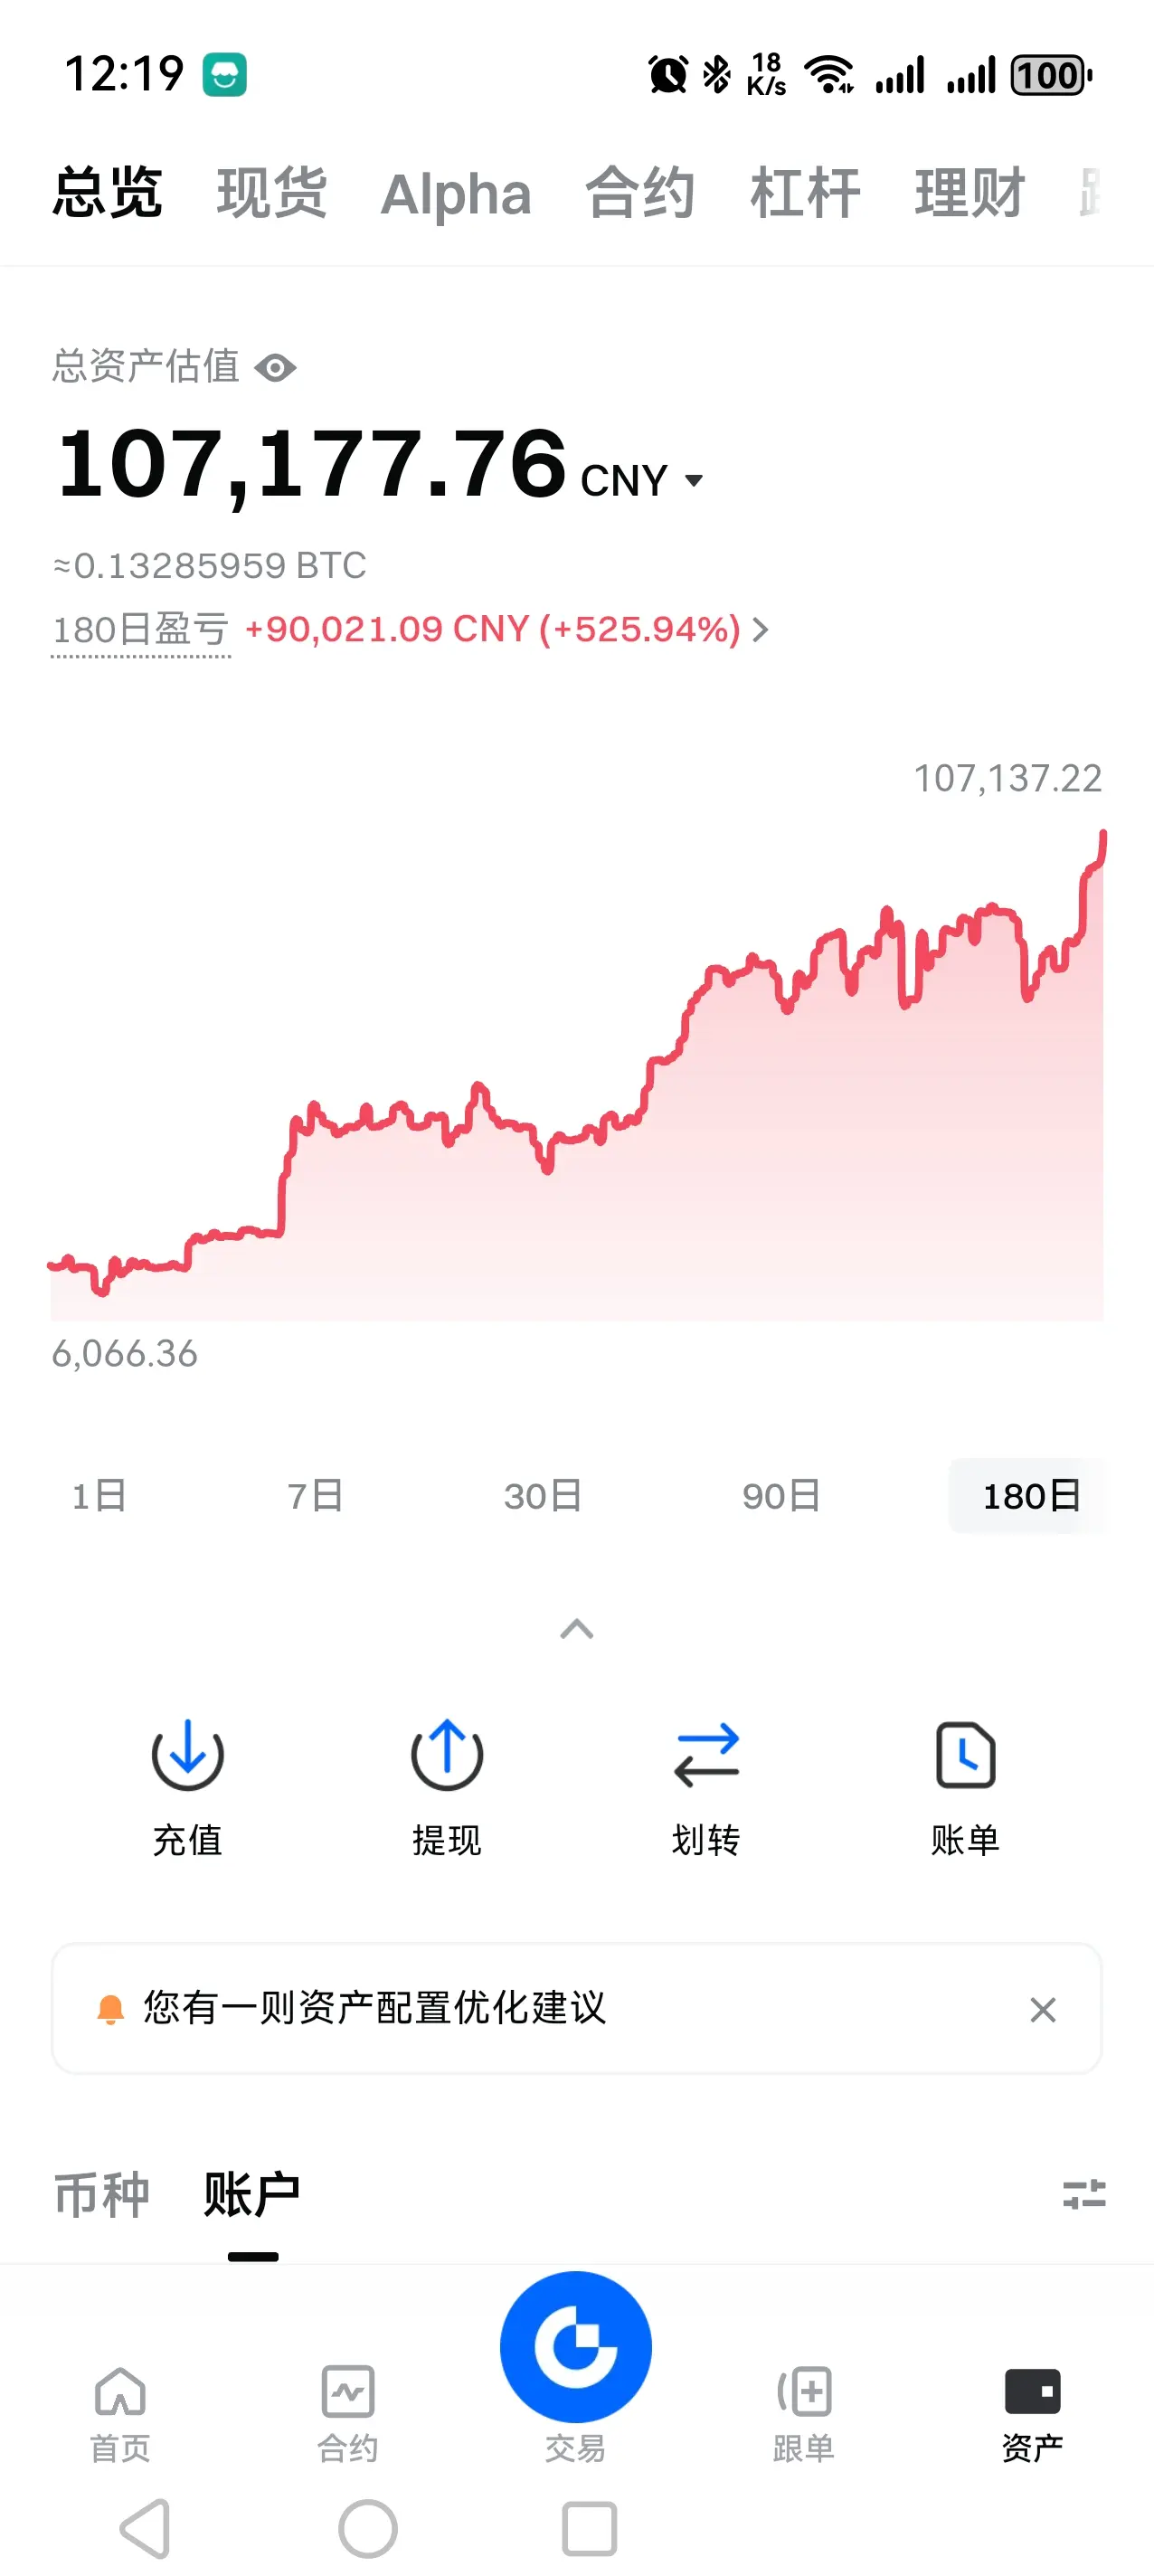
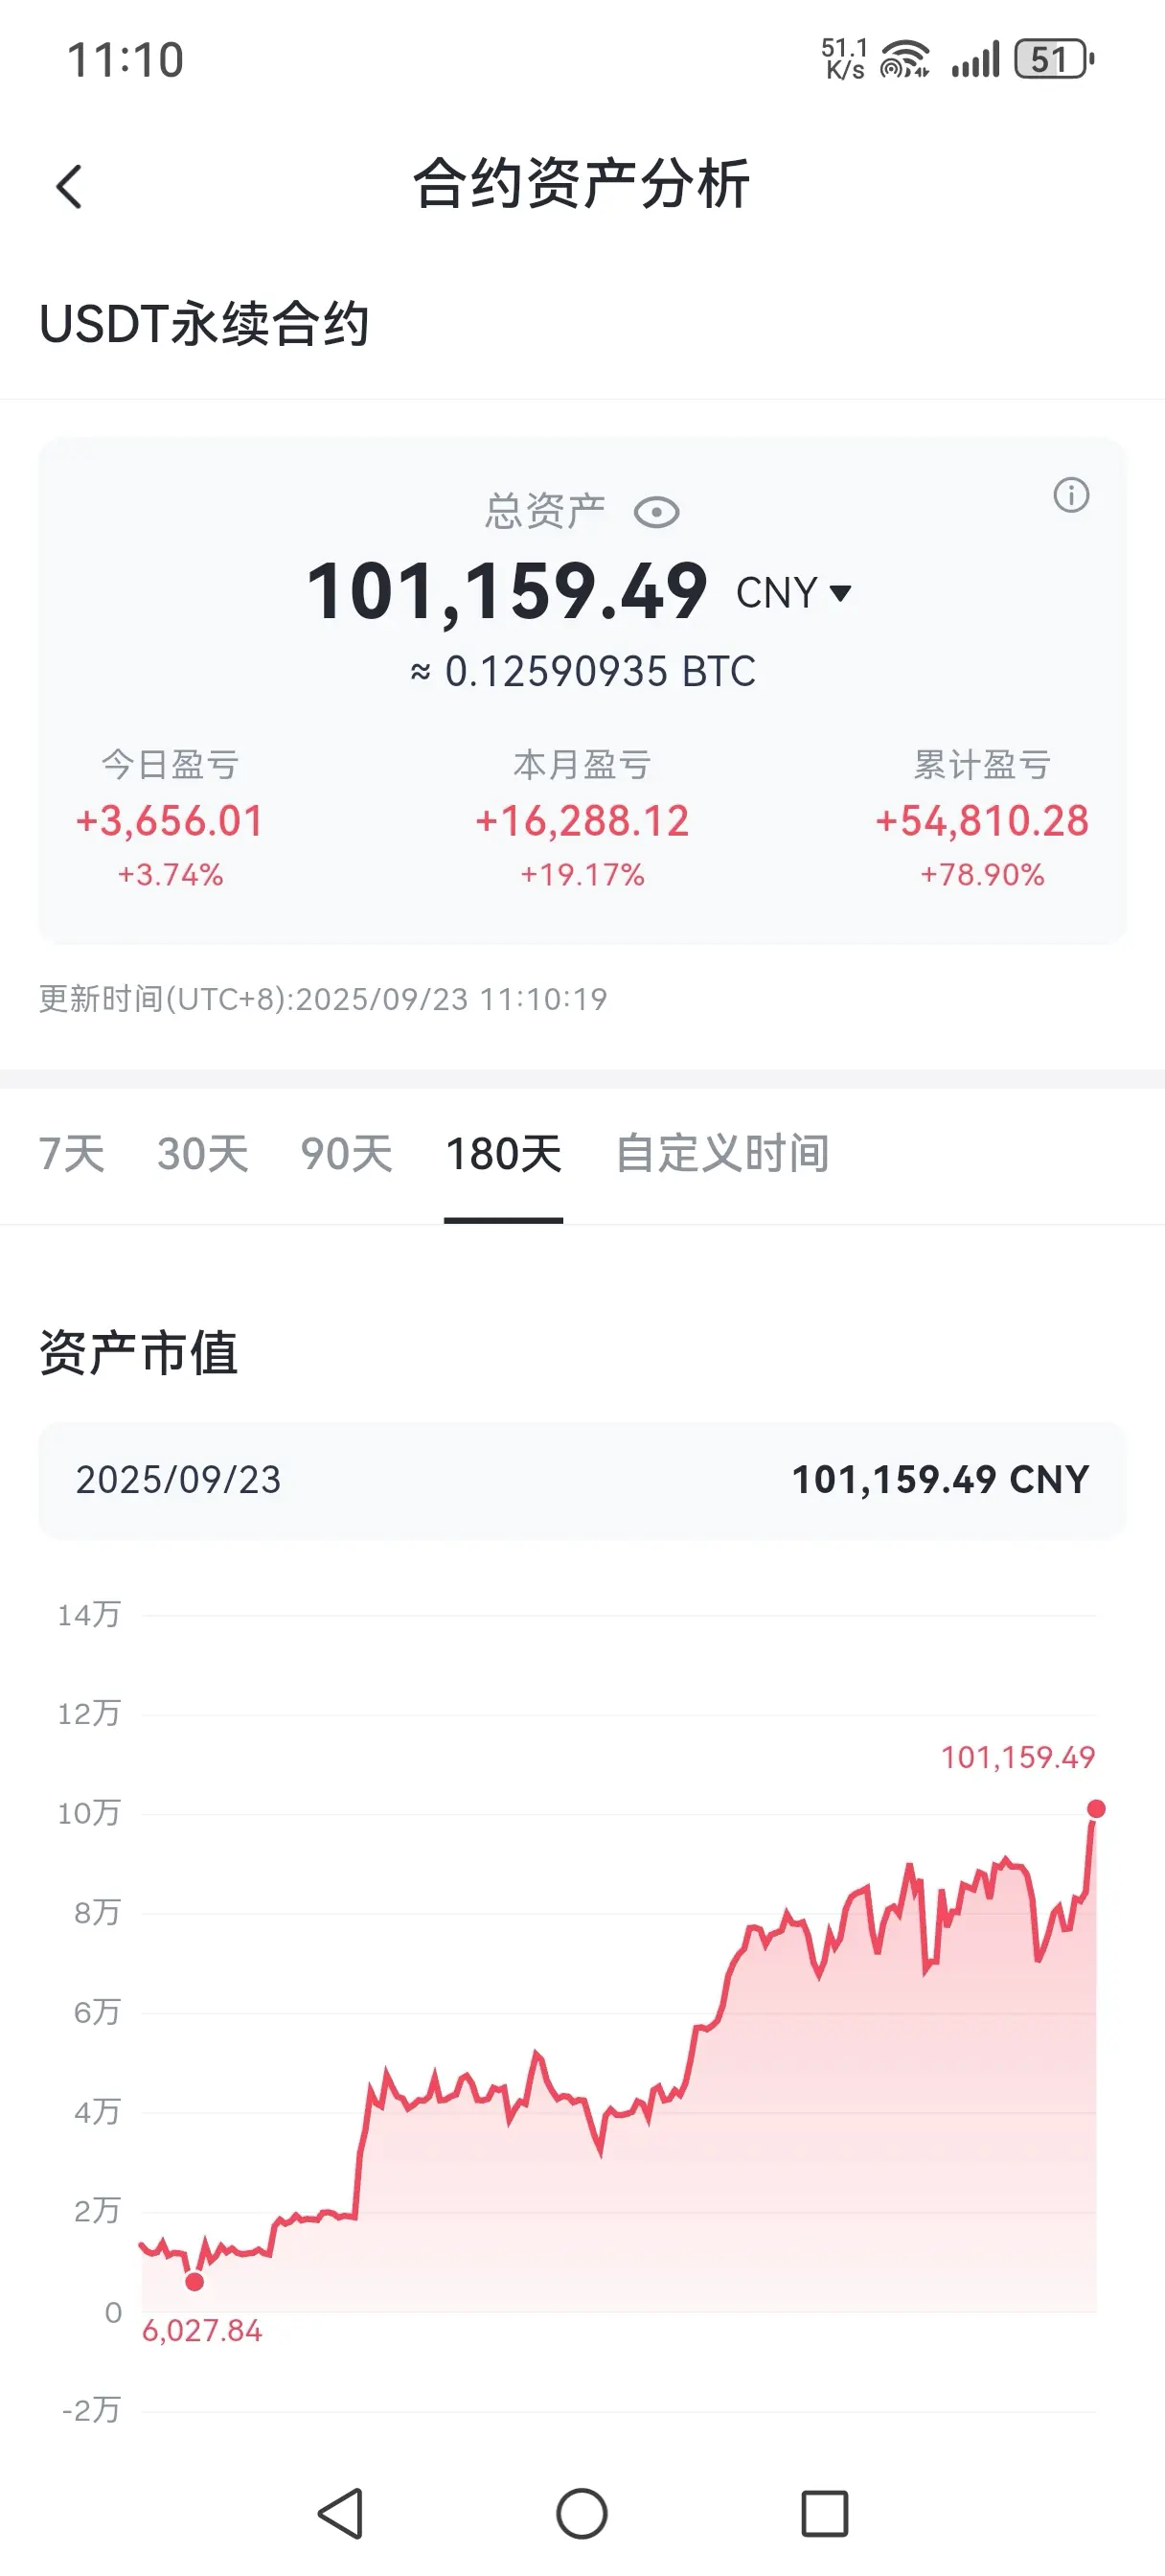
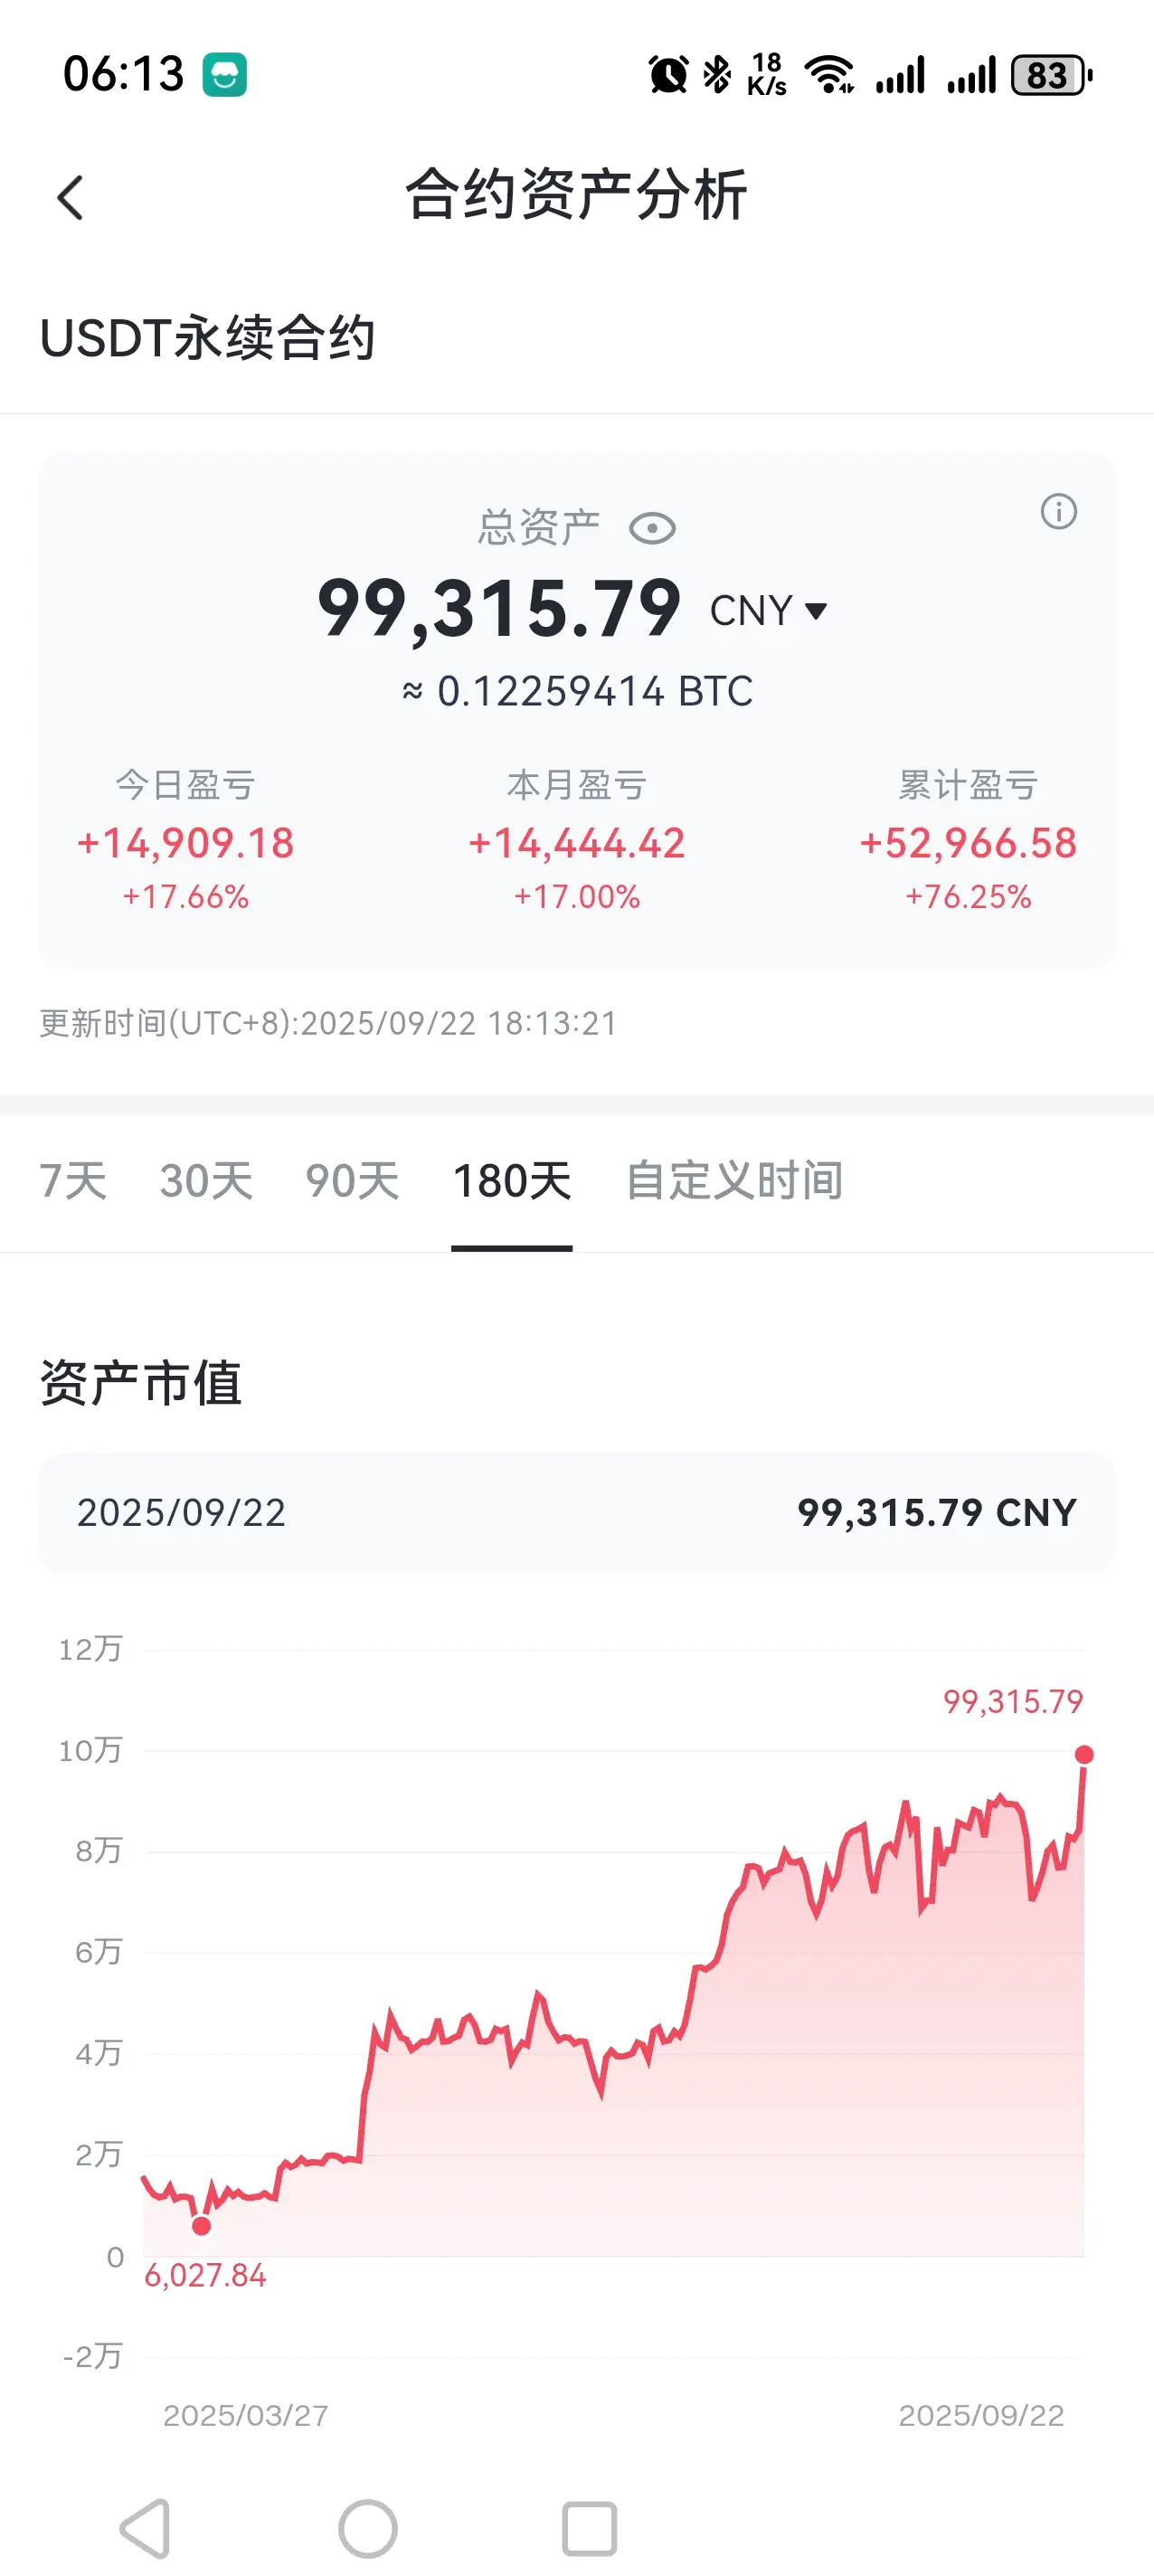
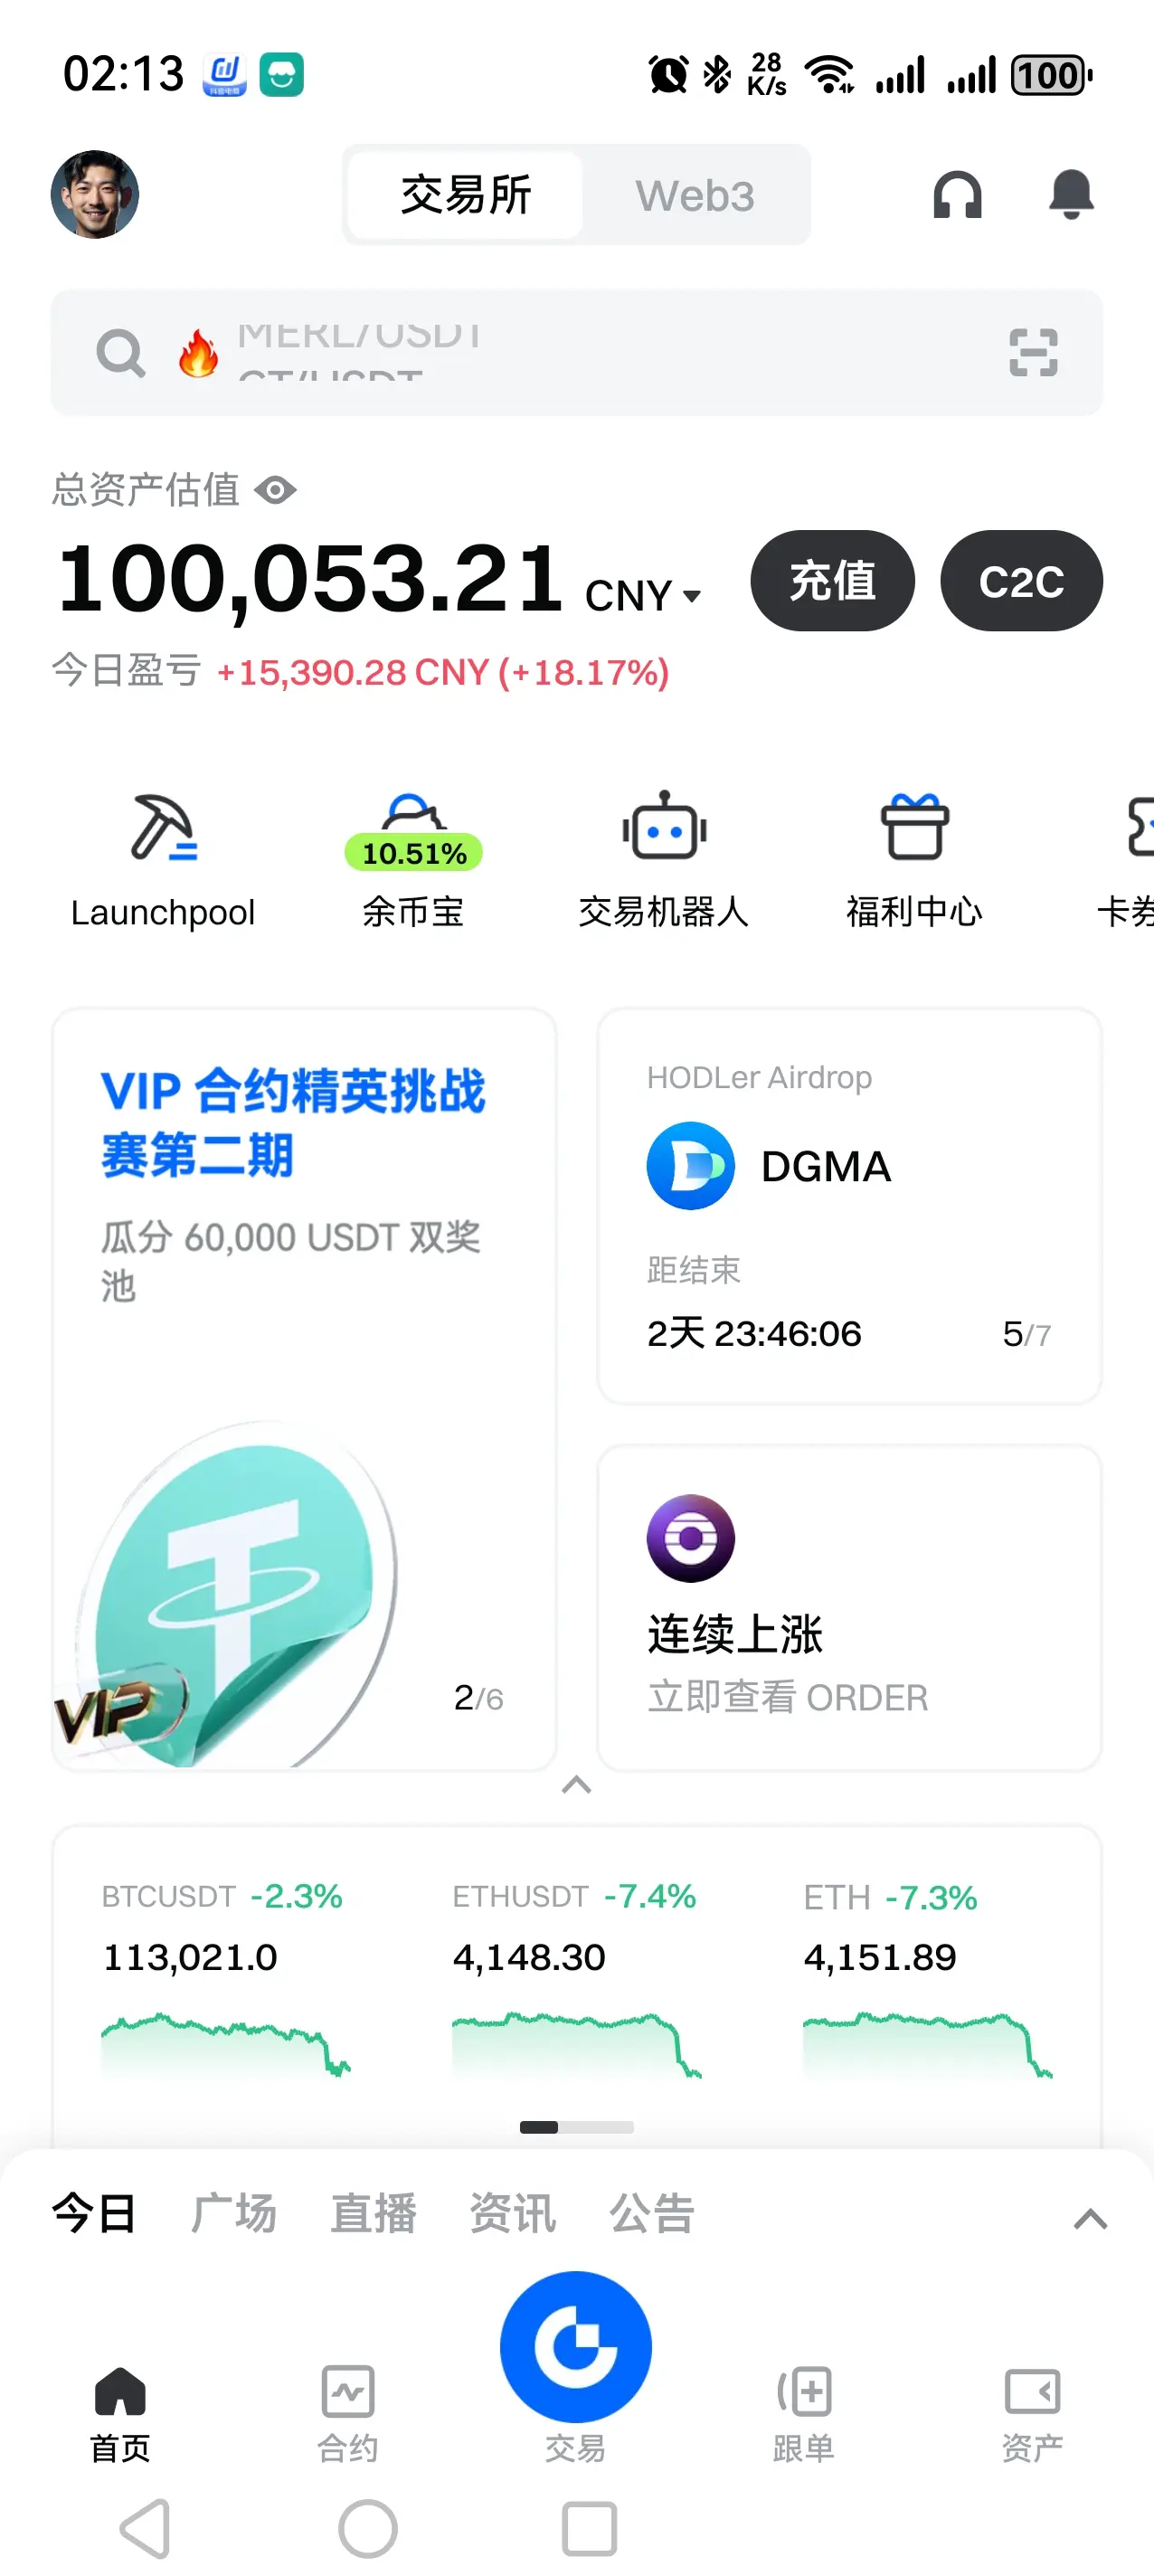
[The user has shared his/her trading data. Go to the App to view more.]